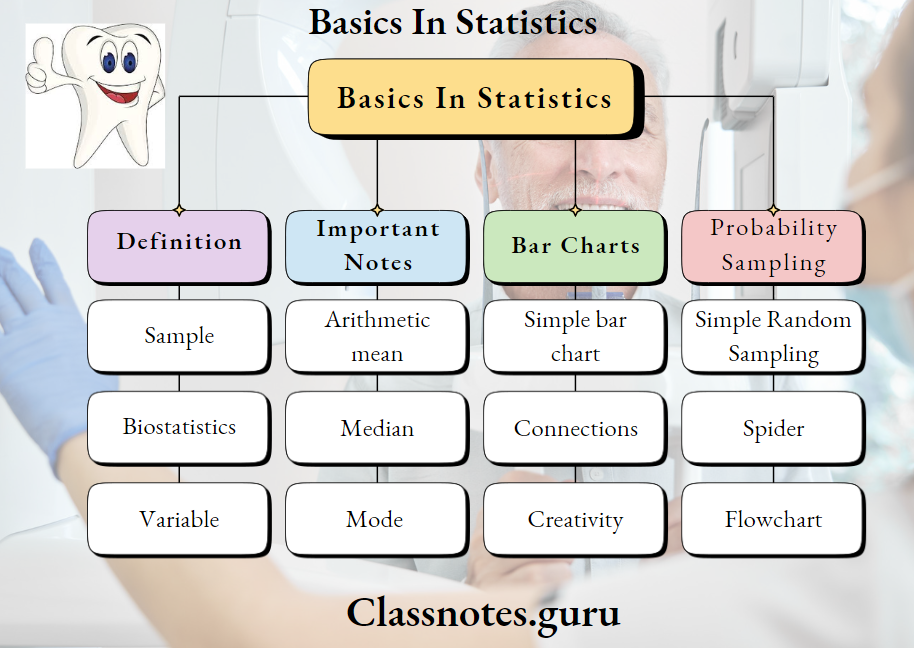
Basics In Statistics Definitions
Sample
The sample is part of a population called the universe, reference, or parent population
Biostatistics
Biostatistics is that branch of statistics concerned with mathematical facts and data related to biological events
Variable
The variable is a state, condition, concept, or event whose value is free to vary within the population
Read And Learn More: Percentive Communitive Dentistry Question And Answers
Basics In Statistics Important Notes
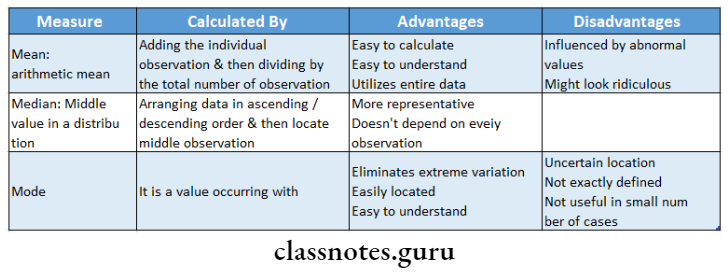
1. Measures of central tendency
- Arithmetic mean
- Simplest measure
- Obtained by summing up all the observations divided by the number of observations
- The arithmetic mean is very sensitive to extreme scores.
- Median
- Median is the simplest division of the set of measurements into two halves
- When the distribution has odd numbers, the middle value is the median, when the distribution has an even number of elements, the average of two middle scores is the median
- The median is insensitive to small numbers.
- Mode
- Mode is the most frequently occurring value in a set of observations
2. Sampling
- Simple random sampling
- Used when the population is small and homogenous.
- Systemic sampling stratified sampling
- Used when the population is large, non-homogenous, and scattered
- Multistage sampling
- Employed in large country surveys
- Carried out in several stages
- Multiphase sampling
- Here sampling is done in different phases
- Cluster sampling
- Involves grouping the population and then surveying
- Stratified sampling
- Used when the population is large, nonhomogenous
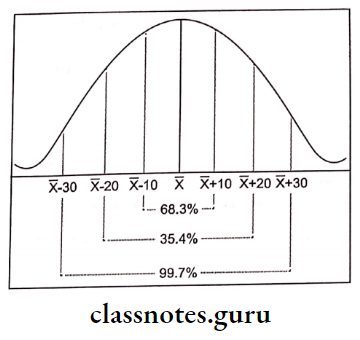
3.Properties Of The Normal Curve
- Bell-shaped
- Symmetrical
- The height of the curve is maximum at the mean
- Mean = median = mode
- The area under the curve between any two points can be found in terms of the relationship between mean and standard deviation.
Mean ± 1 SD = 68.3% of observation
Mean ± 2 SD = 95.4% of observation
Mean + 3 SD = 99.7% of observation
Introduction To Statistics
4. Classification Of Data
- Qualitative data
- Qualitative data is data with frequency but no magnitude
- Nonparametric tests are used for it
- Quantitative data
- Quantitative data is data with a magnitude
- Parametric tests are used for it
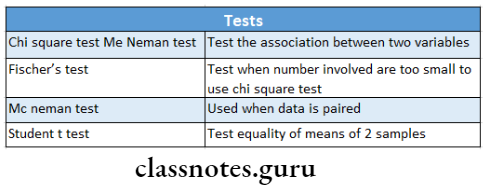
5. The Chi-Square Test Is Used
- To test the association between the cause and effect
- To find the goodness of fit
- To test the differences between two/more proportions
6. Tests
Basics In Statistics Long Essays
Question 1. Define sample. What are the ideal requisites of sampling, describe different sampling methods.
Answer:
Sample:
Sample is part of a population called the universe, reference, or parent population
Sample Ideal Requisites:
- Efficiency
- Representativeness
- Measurability
- Size-large
- Adequate coverage
- Goal orientation
- Feasibility
- Economic
Sample Sampling Methods:
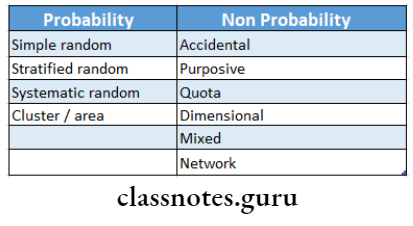
Sample Probability Sampling:
- Simple Random Sampling
- Each member of the population has an equal chance of being included in the sample
- The member is determined by chance only © Methods of random selection are
- Lottery method
- Table of random numbers
- Systematic
- Systematic is obtained by selecting one unit at random and then selecting additional units at evenly spaced intervals till an adequate sample size is obtained
- Systematic can be adopted as long as there is no periodicity of occurrence of any particular event in the population
- Stratified Random
- The population to be sampled is subdivided into strata
- A simple random sample is then chosen from it
- Used for a heterogeneous population
- Systematic ensures more representativeness, provides greater accuracy, and can concentrate over a wider area
- Systematic eliminates sampling variation
Sample Cluster Sampling:
- Useful when a population forms natural groups
- First, a sample of the clusters is selected and then all units in clusters are surveyed
Sample Advantage:
Sample Disadvantage:
Cannot be generalized
Sample Non-Probability Sampling:
Sample Accidental Sampling:
- Sampling is a matter of taking what you can get
- Sampling is not randomly obtained
Sample Advantage:
Sample Accidental Sampling is inexpensive and less time-consuming
Sample Purposive Sampling:
- Sample Purposive Sampling is a nonrepresentative subset of some larger population
- A sample is achieved by asking a participant to suggest someone else willing for the study
1. Quota Sampling:
Quota Sampling involves the selection of proportional samples of subgroups within a target population to ensure generalization
2. Dimensional Sampling:
A small sample is selected then each selected case is examined in detail
3. Mixed Sampling:
Constitute a combination of both probability and nonprobability sampling
Question 2. Define biostatistics. Write in detail the uses of biostatistics in dental public health.
Answer:
Biostatistics:
- Biostatistics is that branch of statistics concerned with mathematical facts and data related to biological events
- Biostatistics deals with the statistical methodologies involved in biological sciences
Biostatistics Uses:
- Measure the state of health of the community
- Identify the health problems
- Compare the health status of one country with another and past status with the present
- Predict health trends
- Plan and administer dental health services
- Evaluate the achievement of public health program
- Fix priorities in public health program
- Evaluate the efficacy of vaccines, sera, etc
- Measure mortality and morbidity
- Test whether the difference between 2 populations is real or a chance occurrence
- Study correlation between attributes in the same population
- Promote health legislation
- Help the dentist to think quantitatively
Statistics Questions And Answers
Question 3. Define sampling. Classify sampling. Enumerate any one sampling.
Answer:
Sampling:
Sampling is the process or technique of selecting a sample of appropriate characteristics and adequate size
Probability Sampling:
Simple Random Sampling:
- Each member of the population has an equal chance of being included in the sample
- The member is determined by chance only
- Methods of random selection are
- Lottery method
- Table of random numbers
Sampling Systematic:
- Sampling Systematic is obtained by selecting one unit at random and then selecting additional units at evenly spaced intervals till an adequate sample size is obtained
- Sampling Systematic can be adopted as long as there is no periodicity of occurrence of any particular event in the population
1. Stratified Random:
- The population to be sampled is subdivided into strata
- A simple random sample is then chosen from it
- Used for a heterogeneous population
- It ensures more representativeness, provides greater accuracy and can concentrate over a wider area
- It eliminates sampling variation
2. Cluster Sampling:
- Useful when a population forms natural groups
- First, a sample of the clusters is selected and then all units in clusters are surveyed
Sampling Advantage:
Sampling Disadvantage:
Cannot be generalized
Question 4. Enumerate various measures of dispersion and describe in detail the test of significance.
Answer:
Measures Of Dispersion:
- Range
- The range of the difference between the smallest and largest results in a set of data
- Mean deviation
- Mean deviation is the average of the deviation from the arithmetic mean
- Standard deviation
Measures Of Dispersion Test Of Significance:
Measures Of Dispersion Test Of Significance deals with the techniques to know how far the differences between the estimates of different samples are due to sampling variations
1. Standard Error of Mean (SE):
Gives the standard deviation of the mean of several samples from the same population
= standard deviation / √n
2. Standard Error of Proportion:
= p and q = proportion of occurrence of an event
in 2 groups
n = sample size
Measures Of Dispersion Standard Error Of Difference Between Two Means:
Indicates whether the samples represent two different universe
Measures Of Dispersion Standard Error Of Difference Between Proportion:
Indicate whether the difference is significant or has occurred by chance
Measures Of Dispersion Chi-Square Test:
Measures Of Dispersion Uses:
- Test whether the difference in the distribution of attributes in different groups is due to sampling variation or not
- Test the significance of the difference between 2 proportion
- Used when there are more than 2 groups to be compared
Measures Of Dispersion Z Test:
- Test the significance of differences in means for large samples
- ‘t’ Test
Measures Of Dispersion Synonym:
Student’s t-test
Measures Of Dispersion Uses:
- Used when the sample size is small
- Used to test the hypothesis
- Find the significance of the difference between the 2 proportions
Measures Of Dispersion Types:
- Unpaired’t’ test
- Applied to unpaired data made on individuals of 2 different sample
- Test if the difference between the means is real or not
Measures Of Dispersion Paired’t test:
Applied to paired data obtained from one sample only
Basics Of Statistics
Question 5. Define biostatistics. Describe in detail the normal curve. Write a note on measures of central tendency.
(or) Normal distribution/ Properties of normal curve/ Gaussian curve.
(or) Mean, Median, Mode.
(or) Measures of central tendency.
Answer:
Biostatistics:
- Biostatistics is that branch of statistics concerned with mathematical facts and data related to biological events
- Biostatistics deals with the statistical methodologies involved in biological sciences
Biostatistics Normal Curve:
- Biostatistics A Normal Curve is a pattern followed by very many sets of continuous measurements.
- Biostatistics A Normal Curve is characterized by a symmetric, bell-shaped curve
- In a normal curve
- The area between one standard deviation on either side of the mean will include approximately 68% of the values
- The area between two standard deviations on either side of the mean will include approximately 95% of the values
- The area between three standard deviations on either side of the mean will include approximately 99.5% of the values
Biostatistics Characteristics:
- Biostatistics Characteristics is smooth, symmetrical bell-shaped
- The maximum number of observations is at the center and gradually decreases at the extremities
- The total area is 1, the mean is 0 and standard deviation is 1
- Mean, median and mode coincide at center
Basics In Statistics Short Essays
Question 1. Presentation of statistical data.
(or) Pie Chart
(or) Histogram
(or) Pictogram
(or) Uses of biostatistics
Answer:
Presentation Of Statistical Data Tabulation
- Tables are simple devices used for data presentation
- Prepared manually or mechanically
Presentation Of Statistical Data Types:
1. Simple Table:
Way table containing one characteristic of data only
Presentation Of Statistical Data Master Table:
Contains all the data obtained from a survey
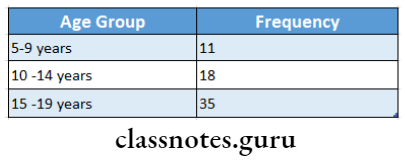
Presentation Of Statistical Data Frequency Distribution Table: Two-column table
- 1st column: lists classes of data
- 2nd column: lists the frequency of each class
Charts/ Diagrams:
1. Bar Charts:
- BarCharts is a diagram of columns/ bars
- The height of the bars determines the value of the particular data
- The width of the bar remains the same
- The bars are separated by spaces
- The bars can be either vertical/ horizontal
Presentation Of Statistical Data Types:
- Simple bar chart
- Represents only one variable
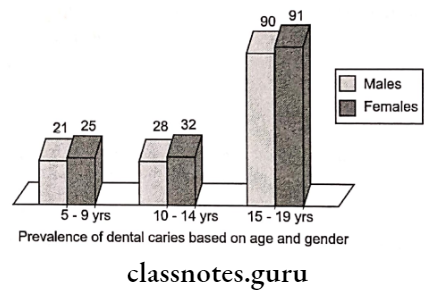
Presentation Of Statistical Data Multiple Bar Chart
Consist of a set of bars of the same width corresponding to the different sections without any gap in between
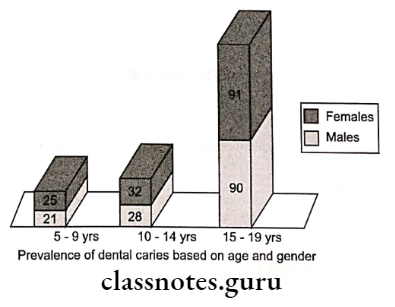
- Component bar chart
- Individual bars are divided into 2 or more parts
- Used to compare the sub-groups
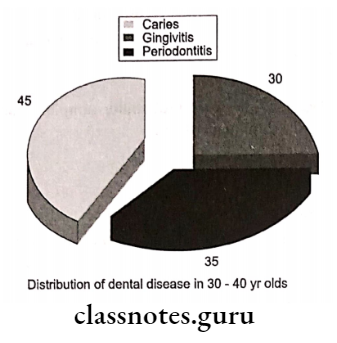
2. Pie Chart:
- The entire graph looks like a pie and its components are represented by its slices
- The Pie Chart is divided into different sectors corresponding to the frequencies of the variables
- The segments are then shaded/ colored
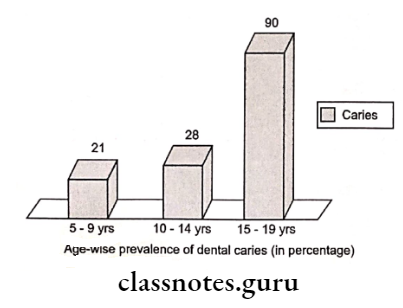
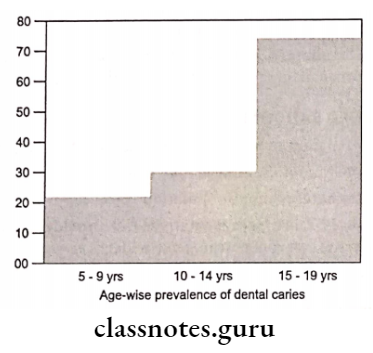
3. Histogram:
- A histogramis a pictorial presentation of data
- Class intervals are presented on the X-axis and frequencies on the Y axis
- No space occurs between the cells
Statistics Mcq With Answers
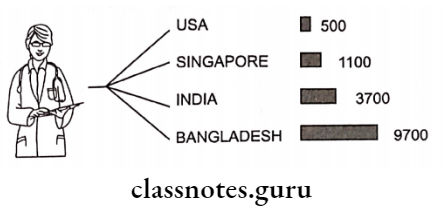
4. Pictogram:
They are small pictures used for data presentation USA
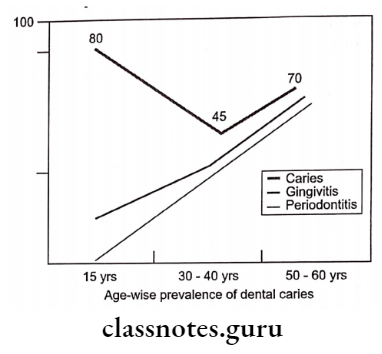
5. Line Diagram:
- Used for continuous variable
- Time is represented on the X-axis and value on the Y-axis
6. Statistical Maps:
- Refer to the geographic area
- Dot/ point is used to represent the area
Question 2. Types of diagram.
Answer:
1. Bar Charts:
- Bar Charts is a diagram of columns/ bars
- The height of the bars determines the value of the particular data
- The width of the bar remains the same
- The bars are separated by spaces
- The bars can be either vertical/ horizontal
Bar Charts Types:
- Simple bar chart
- Represents only one variable
2. Multiple Bar Chart:
Consist of a set of bars of the same width corresponding to the different sections without any gap in between
3. Component Bar Chart:
- Individual bars are divided into 2 or more parts
- Used to compare the sub-groups
4. Pie Chart:
- The entire graph looks like a pie and its components are represented by its slices
- The Pie Chart is divided into different sectors corresponding to the frequencies of the variables
- The segments are then shaded/ colored
5. Histogram:
- A histogram is a pictorial presentation of data
- Class intervals are presented on the X-axis and frequencies on the Y-axis
- No space occurs between the cells
6. Pictogram:
Pictogram are small pictures used for data presentation
Statistics For Beginners
Question 3. Types of samples/ Probability sampling methods/ Sampling methods.
(or) Cluster sampling
Answer:
Probability Sampling
Simple Random Sampling:
- Each member of the population has an equal chance of being included in the sample
- The member is determined by chance only
- Methods of the random selection are e
- Lottery method
- Table of random numbers
Probability Sampling Systematic:
- Probability Sampling Systematic is obtained by selecting one unit at random and then selecting additional units at evenly spaced intervals till an adequate sample size is obtained
- It can be adopted as long as there is no periodicity of occurrence of any particular event in the population
Probability Sampling Stratified Random:
- The population to be sampled is subdivided into strata
- A simple random sample is then chosen from it
- Used for a heterogeneous population
- Stratified Random ensures more representativeness, provides greater accuracy and can concentrate over a wider area
- Stratified Random eliminates sampling variation
Probability Sampling Cluster Sampling:
- Useful when a population forms natural groups
- First, a sample of the clusters is selected and then all units in clusters are surveyed
Probability Sampling Advantage:
Probability Sampling Disadvantage:
Cannot be generalized
Probability Sampling Non-Probability Sampling:
Probability Sampling Accidental Sampling:
- Accidental Sampling is a matter of taking what you can get
- Accidental Sampling is not randomly obtained
Probability Sampling Advantage:
Probability Sampling is inexpensive and less time-consuming
Probability Sampling Purposive Sampling:
- Purposive Sampling is a nonrepresentative subset of some larger population
- A sample is achieved by asking a participant to suggest someone else willing for the study
Probability Sampling Quota Sampling:
Quota Sampling involves the selection of proportional samples of subgroups within a target population to ensure generalization
Probability Sampling Dimensional Sampling:
A small sample is selected then each selected case is examined in detail
Probability Sampling Mixed Sampling:
Constitute a combination of both probability and nonprobability sampling
Question 4. Simple random sampling.
Answer:
Simple Random Sampling
- Each member of the population has an equal chance of being included in the sample
- The member is determined by chance only
- Methods of random selection are the
- Lottery method
- Table of random numbers
Question 5. Multistage sample.
Answer:
Multistage Sample
Multistage sample is a sampling procedure often used when the sampling units can be defined in a hierarchical manner
Multistage Sample Steps:
- Select the groups/cluster
- Then subsamples are taken in subsequent stages
- 1st stage: choice of states within countries
- 2nd stage: choice of towns within each state
- 3rd stage, choice of neighborhoods in each town
Question 6. Tests of significance.
(or)’t’ test.
Answer:
Tests Of Significance
Tests of significance deal with the techniques to know how far the differences between the estimates of different samples is due to sampling variations
Tests Of Significance Standard Error Of Mean(Se):
Gives the standard deviation of the mean of several samples from the same population
Tests Of Significance Standard Error Of Proportion:
\(=\sqrt{\frac{p q}{n}} \mathrm{p} \and \mathrm{q}=\) proportion of occurrence of an event
in 2 groups n= sample size
Tests Of Significance Standard Error Of Difference Between Two Means
Indicates whether the samples represent two different universe
Tests Of Significance Standard Error Of Difference Between Proportion
Indicate whether the difference is significant or has occurred by chance
Tests Of Significance Chi-Square Test
Tests Of Significance Uses:
- Test whether the difference in the distribution of attributes in different groups is due to sampling variation or not
- Test the significance of the difference between 2 proportion
- Used when there are more than 2 groups to be compared
Tests Of Significance Z Test:
Test the significance of differences in means for large samples
Tests Of Significance ‘t’ Test:
Tests Of Significance Synonym:
Student’s t-test
Tests Of Significance Uses:
- Used when the sample size is small
- Used to test the hypothesis
- Find the significance of the difference between the 2 proportions
Tests Of Significance Types:
Tests Of Significance Unpaired ‘t’ test:
- Applied to unpaired data made on individuals of 2 different sample
- Test if the difference between the means is real or not
- Paired’t’ test
- Applied to paired data obtained from one sample only
Descriptive And Inferential Statistics
Question 7. Statistical analysis.
Answer:
Statistical Analysis
- Statistical analysis is based on
- Population
- Statistical analysis is the collection of units of observations that are of interest and is the target of the investigation
- Statistical analysis is essential to identify the population clearly and precisely
- The success of the investigation will depend on the identification of the population
- Variable
- The variableis a state, condition, concept/ event whose value is free to vary within the population
Classification Of Statistical Analysis:
- Independent
- Manipulated/ treated in a study
Statistical Analysis Dependent:
- The result of the independent variable
- Confounding
- Confound the effect of the independent variable on the dependent
- Background
- Considered for possible inclusion in the study
- Probability distribution
- The probability distribution is a link between population and its characteristics
- A probability distribution is a way to enumerate the different values the variable can have and how frequently each value appears in the population
- A probability distribution is characterized by parameters i.e. quantities
Question 8. Standard deviation.
Answer:
Standard Deviation
- Standard deviation is the square root of the mean of the squared deviations from arithmetic
- Standard deviation is the most commonly used measure of dispersion
Standard Deviation Synonym
Root Mean Square Deviation
Standard deviation Calculation
- Calculate the mean of the series, X
- Take the deviation mean X- X,
- Square these deviations and add them up to 5^ 2
- Divide the result by the total number of observation
- Obtain the square root of it (Standard deviation)
Standard Deviation Significance:
- The greater the standard deviation, the greater the magnitude of dispersion
- The lesser the standard deviation, the higher the degree of uniformity of observation
Question 9. Bar diagram/ charts.
Answer:
Bar Diagram
- Bar diagram is a diagram of columns/ bars
- The height of the bars determines the value of the particular data
- The width of the bar remains the same
- The bars are separated by spaces
- The bars can be either vertical/ horizontal
Bar Diagram Types:
1. Bar Diagram Simple Bar Chart
Represents only one variable
2. Bar Diagram Multiple Bar Chart
Consist of a set of bars of the same width corresponding to the different sections without any gap in between
3. Bar Diagram Component Bar Chart
Individual bars are divided into 2 or more parts Used to compare the sub-groups
Basics In Statistics Short Question And Answers
Question 1. Primary and secondary data.
Answer:
Secondary Data Primary Data:
- Obtained directly from an individual
- secondary data Primary Data is first-hand information
Secondary Data Advantage:
- Precise information
- Reliable
Secondary Data Disadvantages:
Secondary Data Methods:
- Direct personal interviews
- Oral health examination
- Questionnaire
Secondary Data Secondary Data:
- Obtained from outside sources
- Used to serve the purpose of the objective of the study
- Example: Hospital records
Introduction To Statistics
Question 2. Frequency polygon.
Answer:
Frequency Polygon
Pictorial presentation of data
Frequency Polygon Method:
- Obtained from histogram
- Mark the midpoint over histogram bars
- Next, connect these points in a straight line
- Example. Agewise prevalence of dental caries
Question 3. Stratified random sampling.
Answer:
Stratified Random Sampling
- The population to be sampled is subdivided into strata
- A simple random sample is then chosen from it
- Used for a heterogeneous population
- Stratified random sampling ensures more representativeness, provides greater accuracy and can concentrate over a wider area
Question 4. Mode.
Answer:
Mode
Mode is a value occurring with the greatest frequency
Mode Advantage:
- Eliminates extreme variation
- Easily located
- Easy to understand
Mode Disadvantage:
- Uncertain location e Not exactly defined
- Not useful in a small number of cases
Basic Statistics Formulas
Question 5. Null hypothesis.
Answer:
Null Hypothesis
- The null hypothesis asserts that there is no real difference between the two groups under consideration and the difference found is accidental and arises out of sampling variation
- The null hypothesis is the first step in the testing of the hypothesis
Question 6. Variable.
Answer:
Variable
Variable is a state, condition, concept, or event whose value is free to vary within the population
Classification Of Variable:
- Independent
- Manipulated/ treated in a study
- Dependent:
- The result of an independent variable
- Confounding
- Confound the effect of the independent variable on the dependent
- Background
- Considered for possible inclusion in the study
Question 7. Qualitative data.
Answer:
Qualitative Data
When data is collected on the basis of attributes/ qualities like sex, it is called qualitative data
Question 8. Chi-square test.
Answer:
Chi-Square Test Uses:
- Test whether the difference in the distribution of attributes in different groups is due to sampling variation or not
- Test the significance of the difference between 2 proportion
- Used when there are more than 2 groups to be compared
Basics In Statistics Viva Voce
- Mean, median and mode are measures of central tendency
- Range, standard deviation, and coefficient of variation are measures of dispersion
- The range is the difference between the smallest item and the value of the largest item
- A census is a collection of information from all the individuals in a population
- Sampling is the collection of information from representative units in a sample
- Standard deviation is the most important and widely used measure of studying dispersion
- A bar diagram is used to represent qualitative data
- Histogram used to depict quantitative data
- A frequency polygon is used to represent the frequency distribution of quantitative data
- A pie diagram is used to show percentage breakdowns for qualitative data
- A line diagram is useful to study the changes in values in the variable over time
- Pictogram is the method to impress the frequency of occurrence of events to the common man
- The chi-square test is a non-parametric test for qualitative data
- For large samples, z test is preferred
- For small samples, a t-test is preferred
- The value of the mean in a normal distribution is zero
- Standard deviation is also called root mean square deviation
- The median is also called the 50th percentile
- The standard error of the mean depicts the deviation