
NCERT Exemplar Solutions for Class 10 Maths Chapter 14 Statistics Introduction
An average is which represents the large number of observations in a concise or single numerical data. It is a representative value around which all the values of the variable concentrate. It is called the measure of central tendency.
The word ‘average’ has been defined differently by various authors. According to Dr. Bowley, “Statistics is the science of averages.”
According to Gorton and Cowden, “An average is a single value within the range of the data used to represent all the values in the series.”
It is clear from the above definitions that an average is a single value that represents a group of values.
Read and Learn More Class 10 Maths Solutions Exemplar
NCERT Exemplar Solutions Class 10 Maths Chapter 14 Statistics
Objectives Of Statistical Averages
The statistical average has the following objectives:
- Provide a Brief Picture of Data: We can present complex data in a simple manner and concise form with the help of averages. An ordinary person can easily remember these averages.
- Comparative Study: Measures of central value make easier the comparison of two or more than two groups. For example, it is impossible to conclude any result on the basis of marks obtained by all the students of two colleges but we can easily conclude by comparing the average marks obtained by both colleges.
- Representation of the Group: Averages represent the picture. the whole group and that value enables Us to gel an idea of the entire data.
Properties Of Statistical Averages
Good averages should possess the following properties:
- An average should be easy to understand and simple to compute.
- It should be properly defined.
- It should be based on all the observations.
- It should be used for further statistical computation.
Types Of Averages
There are different types:
- Mathematical Averages:
- Arithmetic mean,
- Geometric mean,
- Harmonic mean.
- Average Related with Position:
- Median,
- Mode
Statistics Mean
Mean is that value that can be calculated by dividing the sum of all terms of the series by the number of terms of the series.
Characteristics of Mean
- It depends on all the terms of the group.
- It can be calculated easily.
- Its value is definite and based on calculations.
- We can use algebraic methods on it.
- The algebraic sum of deviations measured from the mean is always zero.
- It can be determined in every condition.
- Mean can be a value that does not exist in the series.
For example, the average of 5, 9, and 10 is \(\frac{5+9+10}{3}=8\) which is not an observation in the series. Now, we shall discuss the mean of grouped data.
Direct Method for the Mean of a Grouped Frequency Distribution
Step 1: Find the class mark xi for each class: \(x_i=\frac{\text { lower limit }+ \text { upper limit }}{2}\)
Step 2: Find xi for each i.
Step 3 : Find the mean using the formula, mean = \(\frac{\Sigma f_i x_i}{\Sigma f_i}\)
Direct Method For The Mean Of A Grouped Frequency Distribution Solved Examples
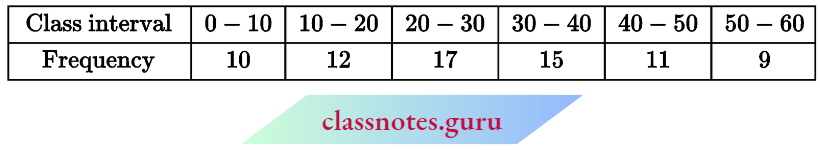
Question 1. Find the mean of the following frequency distribution by direct method:
Solution:
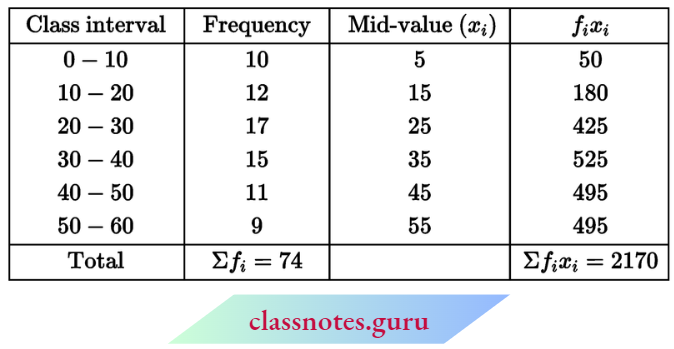
Now, \(\text { mean } \bar{x}=\frac{\Sigma f_i x_i}{\Sigma f_i}=\frac{2170}{74}=29.32\)
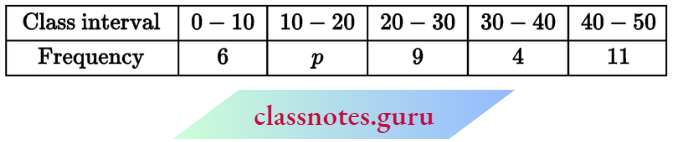
Question 2. If the mean of the following data is 26, then find the value of p:
Solution:
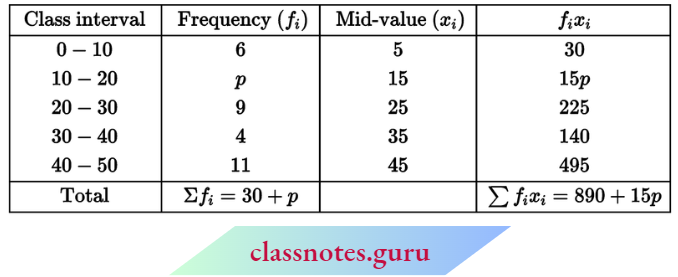
Now, arithmetic mean \(\bar{x}=\frac{\Sigma f_i x_i}{\Sigma f_i}\)
⇒ \(26=\frac{890+15 p}{30+p}\)
⇒ 780 + 26p = 890 + 15p
⇒ 11p = 110
⇒ p = 10
The value of p = 10
Question 3. Find the mean from the following data:
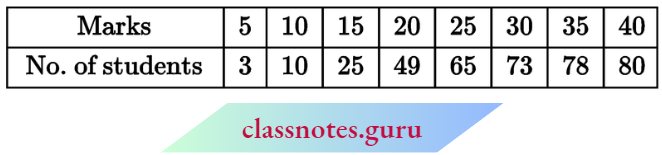
Solution:
First, we will convert the given table into a table containing class intervals and corresponding frequencies:
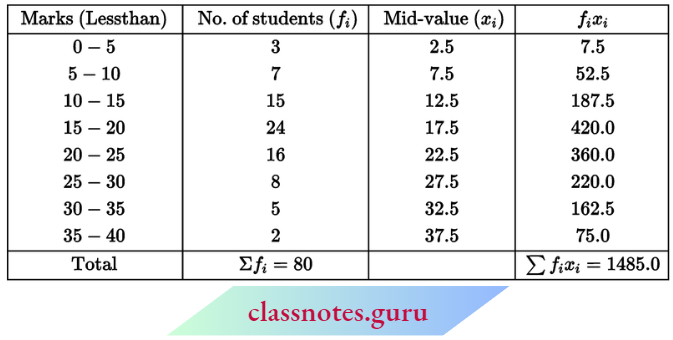
Now, \(\text { mean } \bar{x}=\frac{\Sigma f_i x_i}{\Sigma f_i}=\frac{1485}{80}=18.5625\)
Assumed-Mean Method for the Mean of Grouped Frequency Distribution
Step 1: Find the class marks xi for each class interval: \(x_i=\frac{\text { lower limit }+ \text { upper limit }}{2}\)
Step 2: Choose a suitable value of xi from the middle values as the assumed mean and represent it by ‘a’.
Step 3: Find the deviations di =Xi – a for each i.
Step 4: Fin didi for each i.
Step 5: Find the mean using the formula: \(\bar{x}=a+\frac{\Sigma f_i d_i}{\Sigma f_i}\)
Question 4. Find the mean for the following distribution table by shortcut method:
Solution:
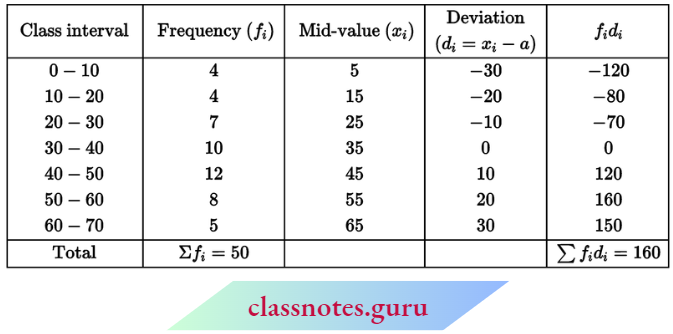
Let assumed mean a = 35
⇒ \(\text { mean } \bar{x}=a+\frac{\Sigma f_i d_i}{\Sigma f_i}=35+\frac{160}{50}=35+3.2=38.2\)
Question 5. The height of 84 trees is given in the following table. Find their arithmetic mean by shortcut method:
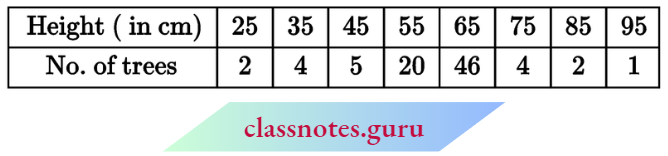
Solution:
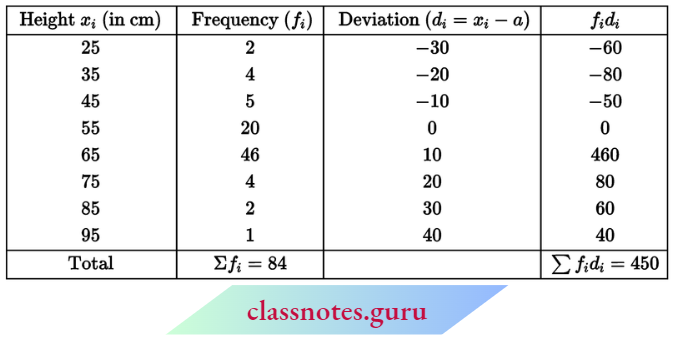
Let assumed mean a = 55
∴ \(\text { mean } \bar{x}=a+\frac{\Sigma f_i d_i}{\Sigma f_i}=55+\frac{450}{84}=55+5.36=60.36 \mathrm{~cm}\)
Step Deviation Method for the Mean of Grouped Frequency Distribution
Step 1: Find the class marks xi for each class. \(x_i=\frac{\text { lower limit }+ \text { upper limit }}{2}\)
Step 2: Choose a suitable value of xi from the middle values as the assumed mean and represent it by ‘a’.
Step 3: Find h = upper limit – a lower limit which is the same for all the classes.
Step 4: Calculate \(u_i=\frac{x_i-A}{h}\) for each i.
Step 5: Calculate fiμi for each i.
Step 6: Find the mean using the formula \(\bar{x}=a+\frac{\Sigma f_i u_i}{\sum f_i} \times h\).
An Important Result
First, we should know the meanings of step and deviation (used in the step-deviation method for finding the mean).
Deviation
All xi’s are deviated (displaced) from their places by adding or subtracting the same non-zero quantity from each value. This is called the deviation.
Step
Big jump or fall in all xi’s in multiples i.e., all xi’s are deviated from their places by multiplying or by dividing with the same number.
But if we divide by only 1, then the step-deviation method and assumed method are the same.
So, if a student is asked to find the mean by step-deviation method and he solves this by assumed mean method then there is no harm.
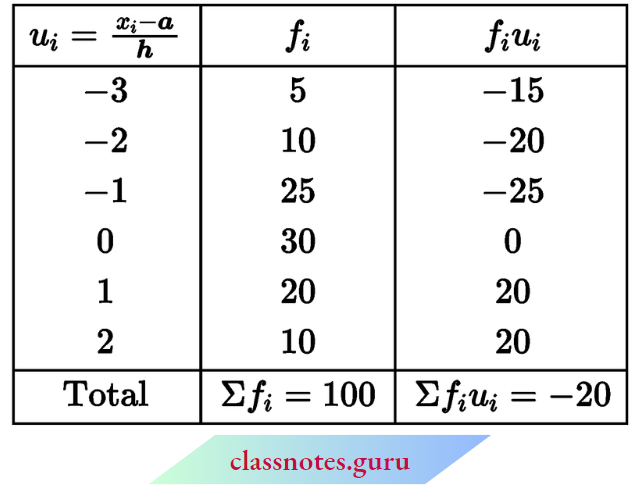
Question 6. Find the mean of the following table by step deviation method:
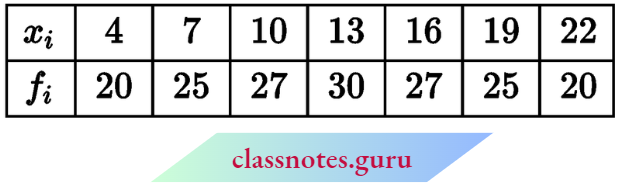
Solution:
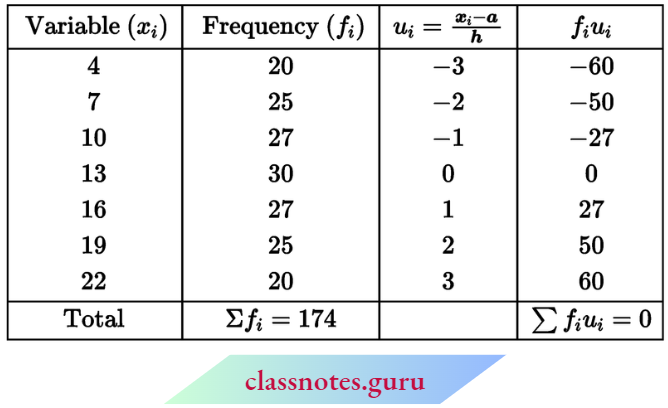
Here, h = 3
Let assumed mean a = 13
∴ \(\text { mean } \bar{x}=a+\frac{\Sigma f_i \cdot u_i}{\Sigma f_i} \times h=13+\frac{0}{174} \times 3=13\)
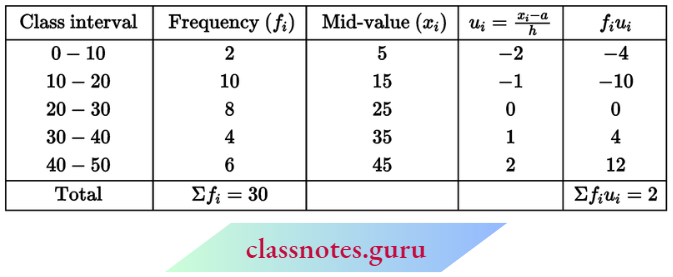
Question 7. The marks obtained by 30 students are given in the following table. Find their mean-by-step deviation method:
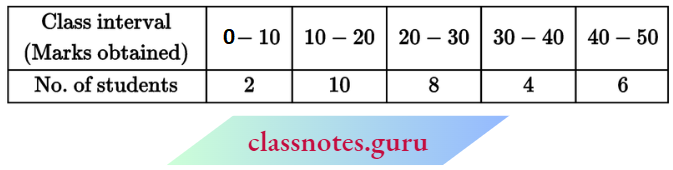
Solution:
Class 10 Statistics NCERT Exemplar
Let assumed mean a = 25
Here, h = 10
∴ \(\text { mean } \bar{x}=a+\frac{\Sigma f_i u_i}{\Sigma f_i} \times h=25+\frac{2}{30} \times 10=25.67\)
Question 8. Find the mean for the following data by step-deviation method:
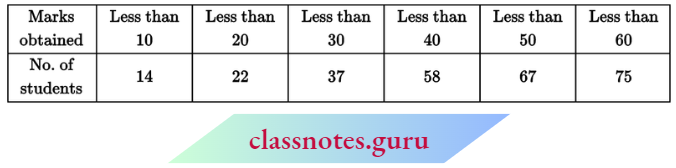
Solution:
The given data can be written in the following form:
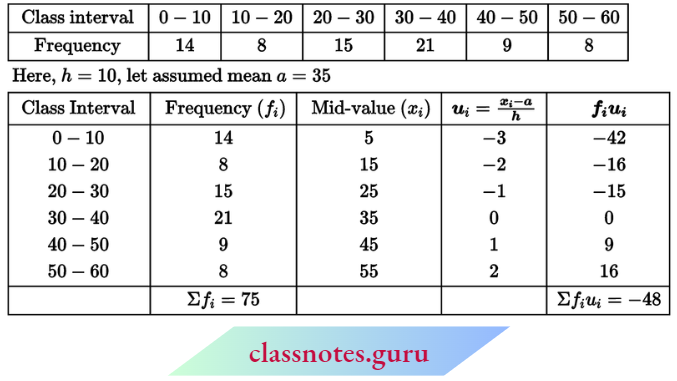
Now, \(\text { mean }=a+\frac{\Sigma f_i u_i}{\Sigma f_i} \times h=35+\frac{-48 \times 10}{75}=28.6\)
Question 9. Find the mean for the following distribution:
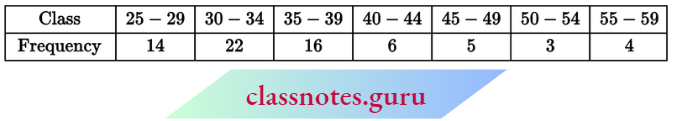
Solution:
First, we will convert the given table into the exclusive form:
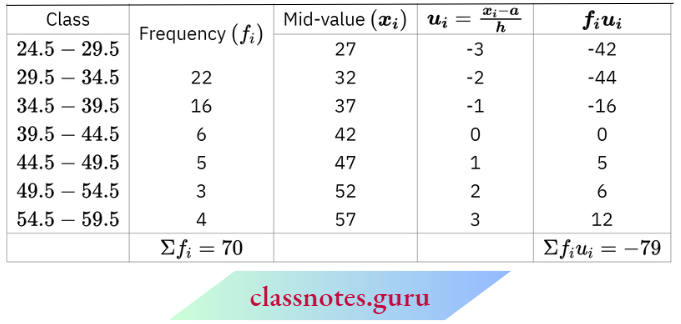
Here, h = 5
Let assumed mean a = 42
Now, \(\text { meàn }=a+\frac{\Sigma f_i u_i}{\Sigma f_i} \times h=42+\frac{(-79) \times 5}{70}=36.36\)
Question 10. Find the class limits corresponding to each frequency if the mean of the following distribution is 33 and the assumed mean is 35:
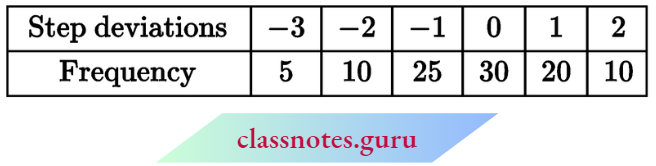
Solution:
Here, we are given \(\bar{x}=33 \text { and } a=35\)
Now, \(\text { mean } \bar{x}=a+\frac{\Sigma f_i u_i}{\Sigma f_i} \times h\)
⇒ \(33=35+\frac{-20}{100} \times h\)
⇒ -200 = -20 h ⇒ h = 10
Now, if \(u_i=-3 \Rightarrow \frac{x_i-35}{10}=-3 \Rightarrow x_i-35=-30 \Rightarrow x_i=5\) and width i.e., h = 10, So, class limits of the first group is 0-10. (subtract and add \(\frac{h}{2}\) from lower and upper boundaries) if \(u_i=-2 ⇒ \frac{x_i-35}{10}=-2 ⇒ x_i-35=-20 x_i=15\) and width i.e., h = 10. So class limits of the second group are 10-20 (subtract and add \(\frac{h}{2}\) from lower and upper boundaries). Similarly, the class limits of other groups are 20-30, 30-40, 40-50 and 50-60.
NCERT Exemplar Solutions for Class 10 Maths Chapter 14 Median
The median is the value of the variable which divides the group into two equal parts, one part comprising all values greater and the other all values less than the median.
or
The median of a series is the value of that actual or estimated when a series is arranged in ascending or descending order which divides the distribution into two equal parts.
Properties acre Merits of Median
- It is easy to calculate and simple to understand. In some cases, it can be located simply by inspection.
- It is a definite average.
- It eliminates the effect of extreme values of variable by which it is not affected.
- It is not capable of further algebraic treatment.
- It can be determined graphically.
- Median can be defined for qualitative data where it is possible to rank the observations in some order.
- Median is especially useful in the case of open-end distributions.
Demerits of Median
- It requires the data to be arrayed which is difficult if a number of data are large.
- Our determination is not based on all the observations.
- The median multiplied by the number of items does arithmetic means.
Median for Ungrouped Data
Method: Arrange the data in ascending or descending order of their magnitudes. Let the total number of observations be N.
- If N is odd, then median = \(\left(\frac{N+1}{2}\right) \text { th term }\)
- If N is even, then median = \(\frac{\frac{N}{2} \text { th term }+\left(\frac{N}{2}+1\right) \text { th term }}{2}\)
Median for Grouped Data
Method: We make the cumulative frequency table for the grouped data. Now we will find that class interval by dividing the total number of frequencies by 2 in which the median lies. This class interval is called the median class. Now we will use the following result to find the median:
Median \(M=l_1+\frac{\left(\frac{N}{2}-C\right)}{f} \times i\)
where l1 = lower limit of the median class
l2 = upper limit of median class
i = l2 – l1
f = frequency of median class
N = sum of frequencies
C = cumulative frequency of the class preceding (just before) the median class
Remark:
If an inclusive (discontinuous) series is given then first of all we will prepare an exclusive series from the given inclusive series. To make it we subtract and add the same number i.e.,
⇒ \(\frac{\text { Lower limit of a class – Upper limit of previous class }}{2}\)
NCERT Exemplar Solutions for Class 10 Maths Chapter 14 Median Solved Examples
Question 1. Find the median from the following table:
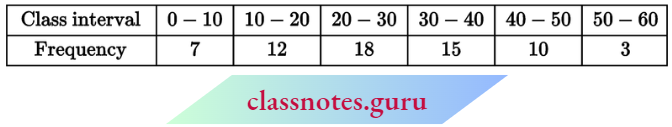
Solution:
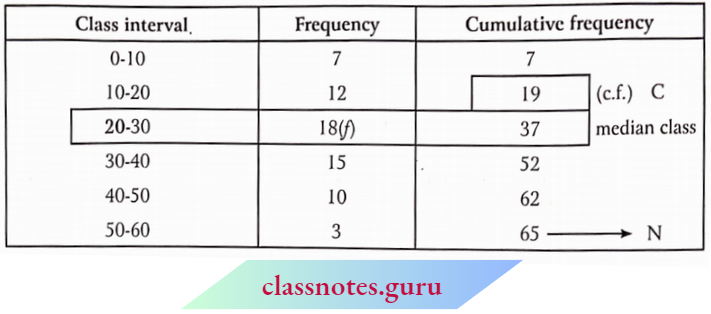
Here, N = 65
∴ For median class \(\frac{N}{2}=\frac{65}{2}=32.5\)
∴ Median class = 20-30
Here l1=20, l2 = 30
⇒ i = 30-20= 10,
f= 18, C= 19
∴ Median \(M=l_1+\frac{\left(\frac{N}{2}-C\right)}{f} \times i=20+\frac{(32.5-19)}{18} \times 10=20+\frac{135}{18}=27.5\)
Question 2. Find the median from the following table:
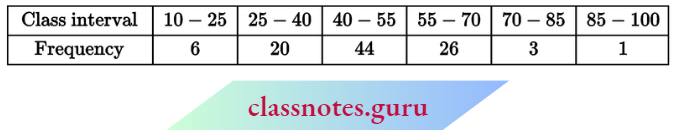
Solution:
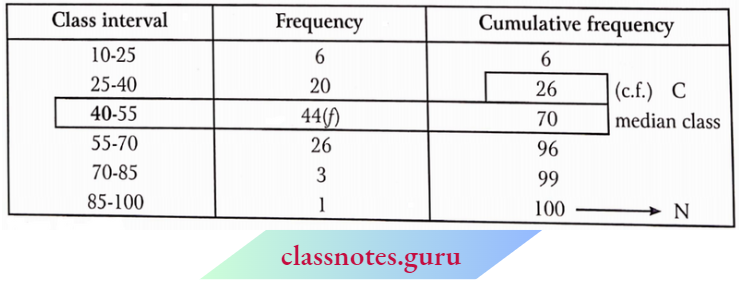
Here, N = 100
⇒ \(\frac{N}{2}=\frac{100}{2}=50\)
Median class = 40-55
Here l1 = 40, l2 = 55
⇒ i = 55 – 40 = 15, f = 44, C = 26
Now, Median \(M=l_1+\frac{\left(\frac{N}{2}-C\right)}{f} \times i=40+\frac{(50-26)}{44} \times 15\)
= \(40+\frac{15 \times 24}{44}=40+8.18=48.18\)
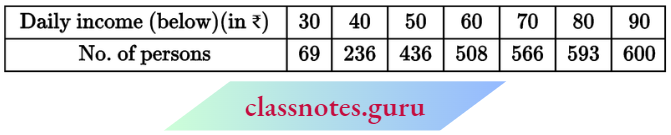
Question 3. Find the median from the following data:
Solution:
Converting into a simple frequency table :
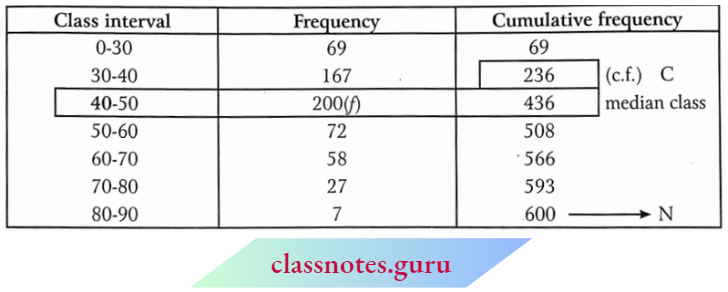
Here, N = 600
⇒ \(\frac{N}{2}=\frac{600}{2}=300\)
∴ Median class = 40-50
and l1 = 40, l2 = 50, i = 50 – 40 = 10, f = 200, C = 236
Now, median \(M=l_1+\frac{\left(\frac{N}{2}-C\right)}{f} \times i=40+\frac{(300-236)}{200} \times 10\)
= \(40+\frac{10 \times 64}{200}=40+3.2=43.2\)
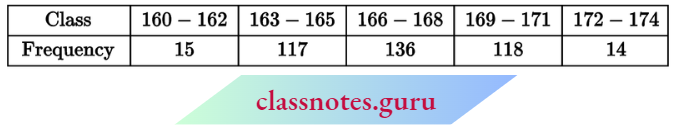
Question 4. Find the median for the following frequency distribution:
Solution:
First, we will convert the given data into exclusive form:
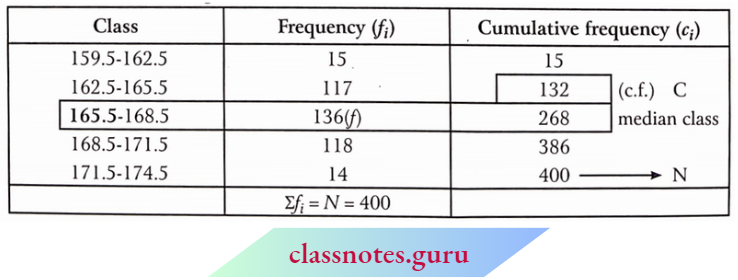
Here, N = 400
⇒ \(\frac{N}{2}=\frac{400}{2}=200\)
Median class is 165.5 – 168.5
Now, l1 = 165.5, l2 = 168.5, i = 1 68.5 – 165.5 = 3, f= 136, C = 132
and median \(M=l_1+\frac{\left(\frac{N}{2}-C\right)}{f} \times i\)
= \(165.5+\frac{(200-132)}{136} \times 3\)
= \(=165.5+\frac{3 \times 68}{136}=167\)
Question 5. Find the median for the following data:

Solution:
Construct the following table from the given data:
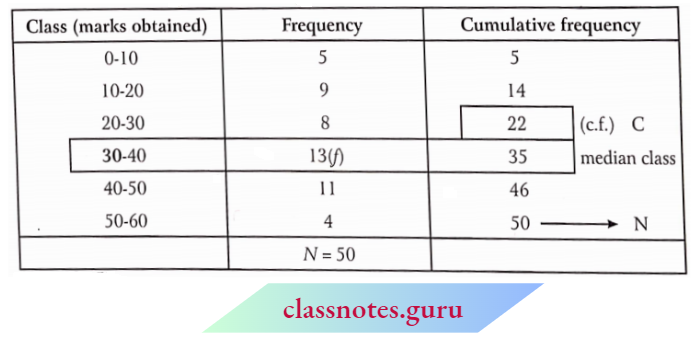
Here, N = 50
⇒ \(\frac{N}{2}=\frac{50}{2}=25\)
The median class is 30 – 40
Now, l1= 30, l2 = 40, i = 40 – 30 = 10, f = 13, C = 22
and median \(M=l_1+\frac{\left(\frac{N}{2}-C\right)}{f} \times i\)
= \(30+\frac{(25-22)}{13} \times 10=32.31\)
Question 6. Find the missing frequency if the median for the given distribution is 24:
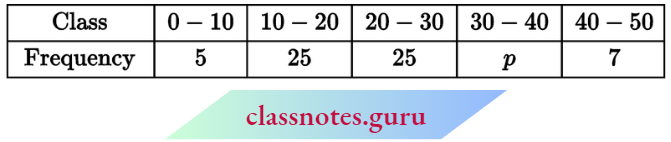
Solution:
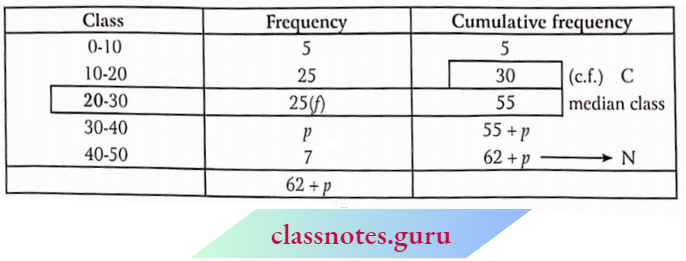
Here, N = 62 + p
⇒ Median = 24
⇒ The median class is 20-30
∴ l1 = 20, l2 = 30 ⇒ i = 30- 20 = 10
f = 25, C = 30
Now, Median \(M=l_1+\frac{\left(\frac{N}{2}-C\right)}{f} \times i\)
⇒ \(24=20+\frac{\left(\frac{62+p}{2}-30\right)}{25} \times 10\)
⇒ \(4=\frac{10}{25}\left(\frac{62+p-60}{2}\right)\)
20 = p + 2 ⇒ p = 18
NCERT Exemplar Solutions for Class 10 Maths Chapter 14 Statistics Mode
Mode is the value of a variable that occurs most often, i.e., the value of the observation having the maximum frequency (most frequent item of the group).
Modal Class
The class having maximum frequency is called the modal class.
Computation of Mode for a Continuous Frequency Distribution
The formula for Calculating Mode:
Mode = \(l+\left(\frac{f_1-f_0}{2 f_1-f_0-f_2}\right) \times h\)
Where, l = lower limit of modal class
l = frequency of modal class
h = width of the modal class
f0 = frequency of the class preceding the modal class
f2 = frequency of the class following the modal class
Step 1: Determine the class of maximum frequency.
Step 2: Obtain all values required in the formula.
Step 3: Substitute values in the formula and solve.
Mode Solved Examples
Question 1. Compute the mode for the following frequency distribution:
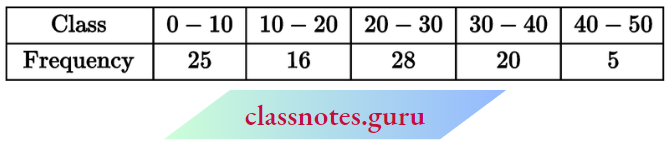
Solution:
The modal class is 20-30 as it has the maximum frequency.
∴ I = 20, f1 = 28, f0 = 16, f2 = 20
and h = 10
Mode \(M=l+\frac{f_1-f_0}{2 f_1-f_0-f_2} \times h\)
Mode \(M=20+\frac{28-16}{2 \times 28-16-20} \times 10\)
= \(20+\frac{12}{56-16-20} \times 10=20+\frac{12}{20} \times 10=26 \)
Hence, mode = 26
Question 2. Calculate the value of mode for the following frequency distribution:
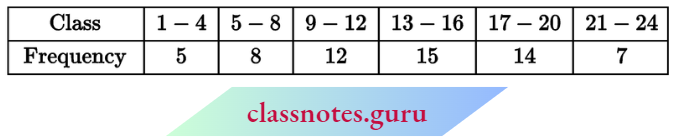
Solution:
The given data is in inclusive form. So, we convert it into exclusive form, as given below:
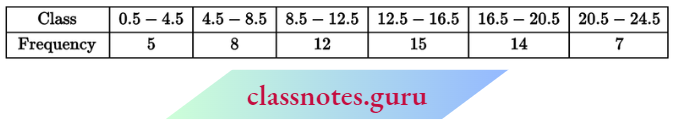
The modal class is 12.5 – 16.5 as it has the maximum frequency.
l =12.5, f1 = 15, f0 = 12, f2 = 14, h = 4
Mode = \(l+\frac{f_1-f_0}{2 f_1-f_0-f_2} \times h\)
Mode = \(12.5+\frac{15-12}{2 \times 15-12-14} \times 4\)
= \(12.5+\frac{3}{4} \times 4=12.5+3=15.5\)
Hence, mode = 15.5
Question 3. The mode of the following series is 17.3. Find the missing frequency:
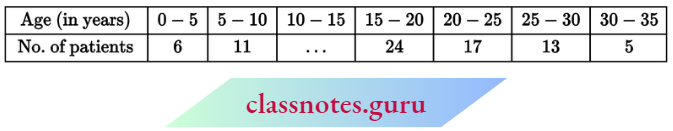
Solution:
15-20 is the modal class as mode 17.3 lies in this class.
Here, l = 15, f1 = 24, f0=x (say), f2 = 17 and h = 5 and mode = 17.3
∴ Mode(M) = \(l+\frac{f_1-f_0}{2 f_1-f_0-f_2} \times h\)
⇒ \(17.3=15+\frac{24-x}{2 \times 24-x-17} \times 5\)
⇒ \(17.3=15+\frac{24-x}{31-x} \times 5\)
⇒ 2.3 (31 – x) = 120-5x
⇒ 2.3 x 31 – 2.3 x = 120 – 5x
⇒ 5x – 2.3 x = 120 – 71.3
⇒ 2.7 x = 48.7
∴ \(x=\frac{48.7}{2.7}=18.03\)
Hence, the missing frequency is 18.
Question 4. A survey regarding the heights (in cm) of 50 girls in class 10 of a school was conducted and the following data was obtained:
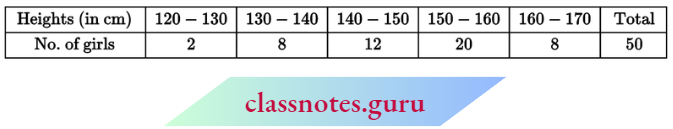
Find the mean, median, and mode of the above data.
Solution:
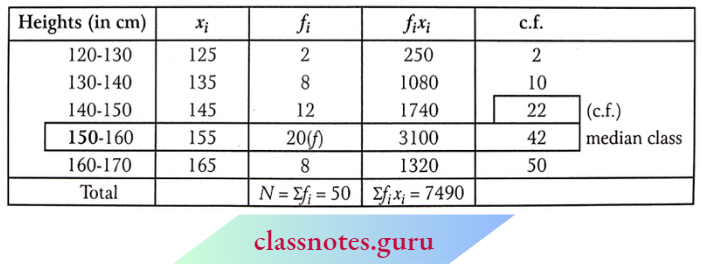
1. Mean: Mean = \(\frac{\Sigma f_i x_i}{\Sigma f_i}=\frac{7490}{50}=149.80\)
2. Median: Here, \(\frac{N}{2}=\frac{50}{2}=25\)
∴ The median class is 150 – 160
∴ Median = \(l_1+\frac{\left(\frac{N}{2}-C\right)}{f} \times i\)
= \(150+\frac{25-22}{20} \times 10\)
= 150 + 1.5 = 151.5
3. Mode: The modal class is 150-160 as it has the maximum frequency.
∴ Mode = \(\text { Mode }=l+\left(\frac{f_1-f_0}{2 f_1-f_0-f_2}\right) \times h\)
= \(150+\left(\frac{20-12}{40-12-8}\right) \times 10\)
= \(150+\frac{8}{20} \times 10\)
= 150 + 4 = 154.
Hence, the mean height of the girls = 149.80 cm
the median height = 15 1.5 cm
Empirical Relationship Between Three Measures of Central Tendency
The relationship between mean, median, and mode is.
Mode = 3(Median) – 2(Mean)
and the modal height = 154 cm
Statistics Class 10 Exemplar Questions with Solutions
NCERT Exemplar Solutions for Class 10 Maths Chapter 14 – Empirical Relationship between Three Measures of Central Tendency Solved Examples
Question 1. Find the mean and median of the following frequency distribution:
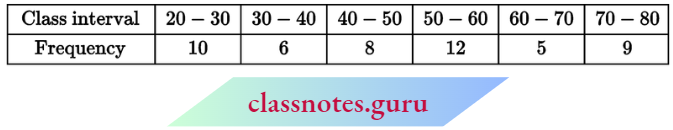
Also, find the mode of the following data.
Solution:
We have
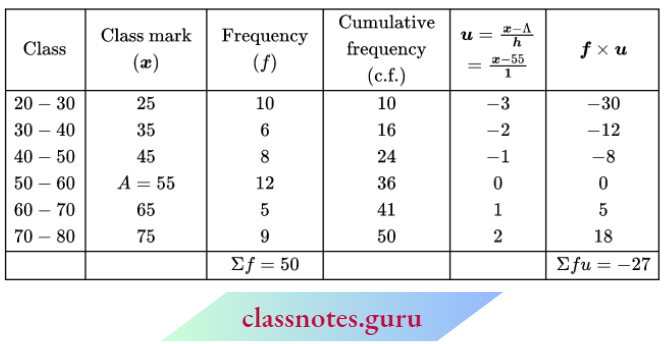
Let assumed mean A = 55, h= 10, Σf= 50 and Σfu = -27
Mean \(\bar{x}=A+\left[h \times \frac{\Sigma(f u)}{\Sigma f}\right]\)
⇒ \(\bar{x}=55+\left(10 \times \frac{-27}{50}\right)\)
⇒ \(\bar{x}=55-5.4\)
⇒ \(\bar{x}=49.6\)
Here, N = 50 \(\frac{N}{2}=\frac{50}{2}=25\)
Cumulative frequency greater than 25 is 36 and the corresponding class is 50-60.
∴ l1=50,/= 12, l2 = 60, C = 24, i = 60-50= 10
Now, \(\text { median }(M)=l_1+\frac{\left(\frac{N}{2}-C\right)}{f} \times i\)
= \(50+\frac{10}{12}(25-24)=50+\frac{10}{12}\)
= 50 + 0.83 = 50.83
Mode = 3(Median) – 2(Mean)
Mode = 3 x 50.83- 2 x 49.60
= 152.49-99.20 = 53.29
Mode = 53.29
NCERT Exemplar Solutions for Class 10 Maths Chapter 14 Cumulative Frequency Curve (Or Ogive)
An ogive is a freehold graph showing the curve of a cumulative frequency distribution.
If we plot the points talcing the upper limit of the class intervals as x coordinates and their corresponding cumulative frequencies asy coordinates and then join these points by a free hand curve, the curve so obtained is called the cumulative frequency curve.
We may follow the following steps:
- Step 1: Construct a cumulative frequency table.
- Step 2: Mark the actual class limits along the X-axis.
- Step 3: Mark the cumulative frequency of respective classes along the Y-axis.
- Step 4: Plot the points corresponding to cumulative frequency at each upper limit point.
- Step 5: Join the points plotted by a free-hand curve.
Less Than Series
When we mark the upper-class limits along the X-axis and corresponding cumulative frequency polygon along the 7-axis, then the obtained curve is called cumulative frequency curve or ogive for less than series.
Greater Than Series
When we mark the lower class limits along the X-axis and corresponding cumulative frequency polygon along the Y-axis, then the curve so obtained is called cumulative frequency curve or ogive for greater than series.
To Obtain Median From Cumulative Frequency Curve
Method-1
Step 1: Draw a cumulative frequency curve for the given frequency distribution.
Step 2: Locate \(\frac{N}{2}\) on the Y-axis. Let it be M.
Step 3: From point M draw a line parallel to X-axis cutting the curve at point N.
Step 4: From N, draw NP perpendicular to the X-axis cutting the X-axis at P.
The value of P is the median of the data.
Method-2
Step 1: Draw both ogives (less than series and more than series) on the same axis.
Step 2: From the point of intersection of these curves draw perpendicular X-axis. Let it meet the X-axis at point M. Value of M is the required median.
NCERT Exemplar Solutions for Class 10 Maths Chapter 14 – To Obtain Median From Cumulative Frequency Curve Solved Examples
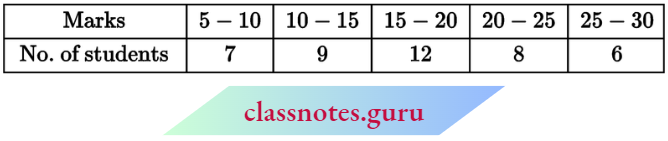
Question 1. Draw a less than cumulative frequency curve (ogive) for the following distribution:
Solution:
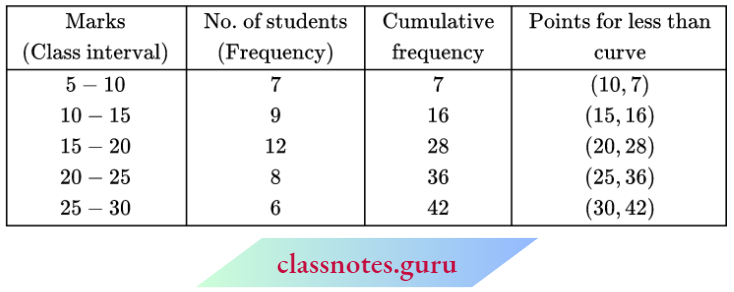
Taking upper-class limits along the X-axis and corresponding cumulative frequencies along the Y-axis mark the points (10, 7) (15, 16), (20, 28), (25, 36), and (30, 42).
Join the points marked by a free-hand curve.
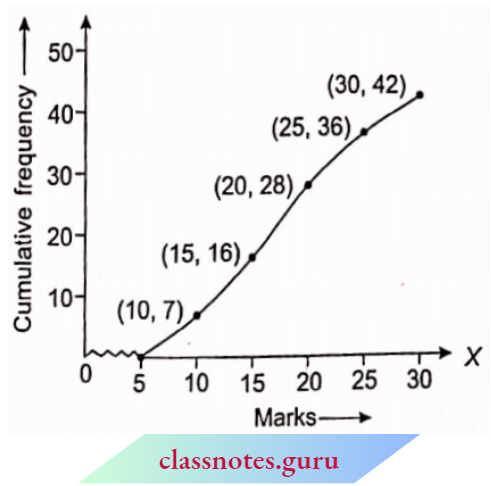
Remark:
Students are advised to leave some points (one on two) without joining, which do not lie on the curve. It is not necessary to join all the points.
This will not affect the median. You can imagine that the given information is not correct, but you have to make a free-hand curve.
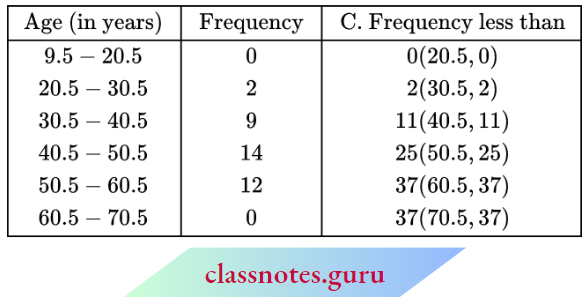
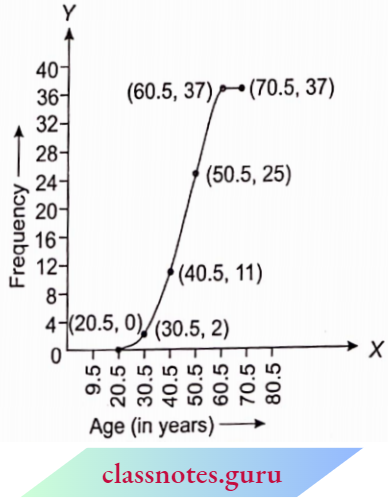
Question 2. In a study of the cases of diabetes the following data was obtained:
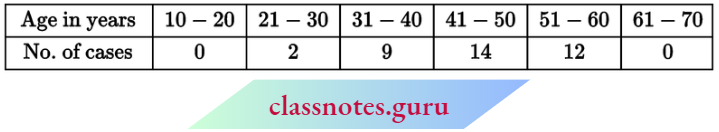
Draw a less than ogive for the above data.
Solution:
The given frequency distribution is discontinuous, to convert it into a continuous distribution, we subtract 0.5 from the lower limit and add 0.5 to the upper limit respectively. So, the continuous cumulative frequency distribution table is as follows:
Required ogive is given below:
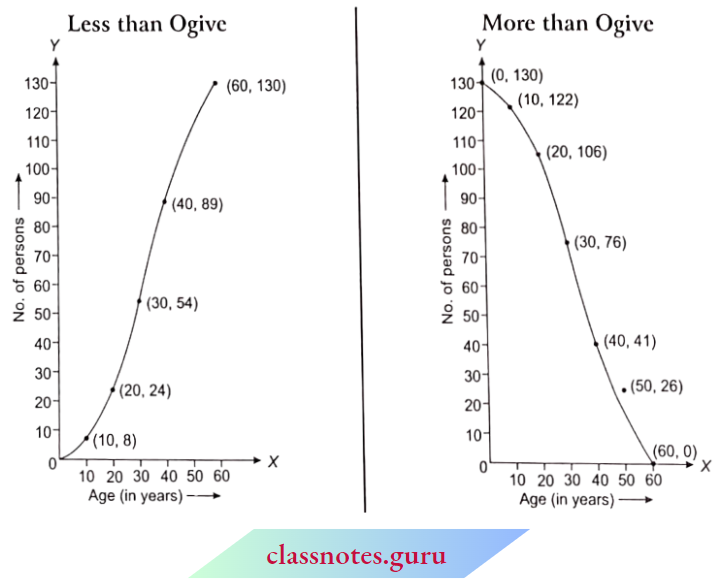
Question 3. Construct a less than ogive and a more than ogive from the following data:
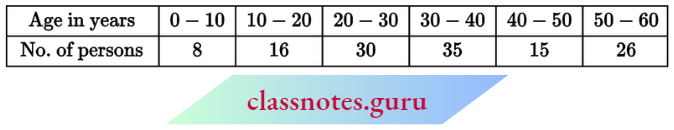
Solution:
Cumulative frequency distribution table according to ages (in years) less than and more than are:

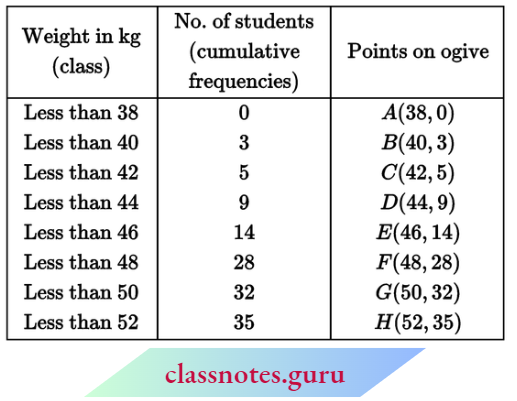
Question 4. During the medical checkup of 35 students of a class, their weights were recorded as follows:
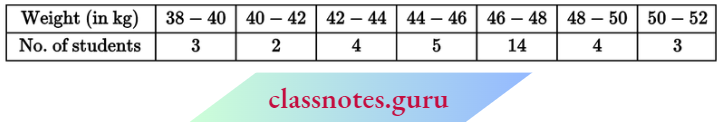
Draw a less than type and a more than type ogive from the given data. Hence obtain the median weight from the graph.
Solution:
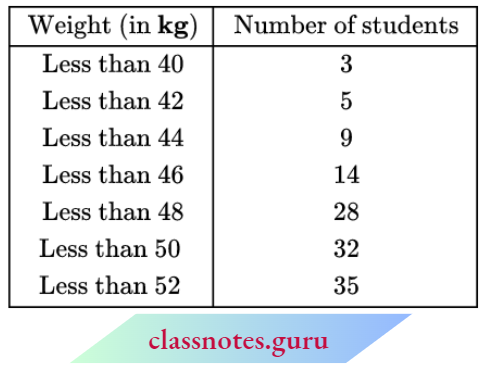
1. Less than Series:
We may prepare the less-than series as follows:
Scale:\(\left\{\begin{array}{l}
\text { Along the } X \text {-axis, } 5 \text { small div. }=1 \mathrm{~kg} . \\
\text { Along the } Y \text {-axis, } 10 \text { small div. }=5 \mathrm{~kg} .
\end{array}\right.\)
We plot the points A(40, 3), B(42, 5), C(44, 9), D(46, 14), E(48, 28), F(50, 32) and G(52, 35).
Join AB, BC, CD, DE, EF, and FG with a free hand to get the curve representing ‘Less than series’.
2. More than Series:
We may prepare more than one series as follows:
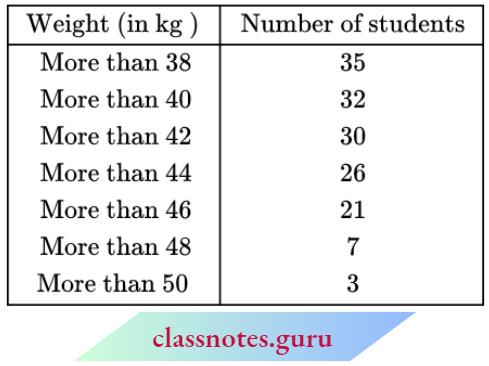
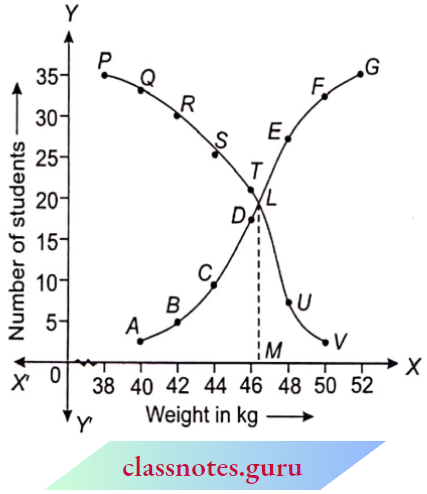
On the same graph-paper as above we plot the points E(38, 35), Q(40, 32), R(42, 30), S(44, 26), 7(46, 21); (7(48, 7) and 7(50, 3). Join EQ, QR, RS, ST, TV, and UV with a free hand to get the curve representing ‘More than series’.
Scale:\(\left\{\begin{array}{l}
\text { Along the } X \text {-axis, } 5 \text { small div. }=1 \mathrm{~kg} \\
\text { Along the } Y \text {-axis, } 10 \text { small div. }=5 \text { students }
\end{array}\right.\)
The two curves intersect at point L. Draw LM ⊥ OX.
∴ Median weight = OM = 46.5 kg
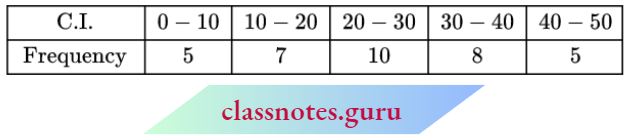
Question 5. Find the median for the following distribution:
Solution:
Using the given data, first of all, construct a cumulative frequency table and then draw ogive (cumulative frequency curve).
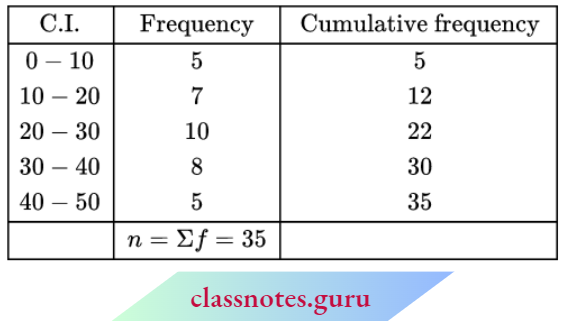
Since, the no. of terms, n = 35
∴ Median = \(\left(\frac{n+1}{2}\right) \text { th term }\)
= \(\left(\frac{35+1}{2}\right) \text { th term }=18 \text { th term }\)
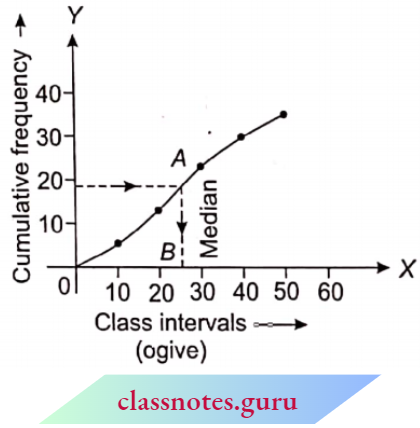
Through mark 18 on the Y-axis, draw a horizontal line that meets the curve at point A.
Through point A, on the curve, the draw meets the X-axis at point B. The value of point B on the X-axis is the median.
It is clear from the cumulative frequency curve drawn that the die median is 26.
Class 10 Maths Chapter 14 Solutions
NCERT Exemplar Solutions for Class 10 Maths Chapter 14 Statistics Excercise 14.1
Question 1. A survey was conducted by a group of students as a part of their environment awareness program, in which they collected the following data regarding the number of plants in 20 houses in a locality. Find the mean number of plants per house.
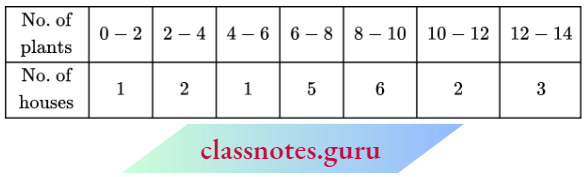
Which method did you use for finding the mean, and why?
Solution:
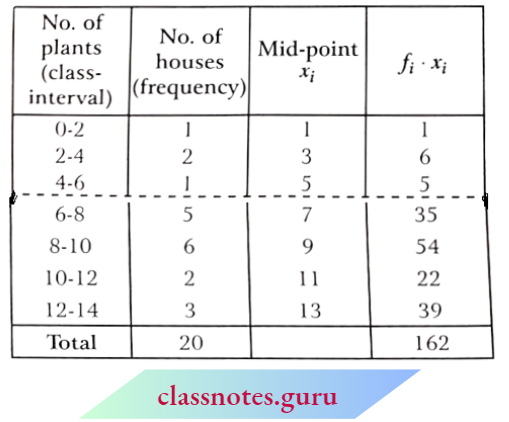
Mean \(\bar{x}=\frac{\sum f_i \cdot x_i}{\sum f_i}=\frac{162}{20}=8.1\)
∴ The mean number of plants per house = 8.1.
The direct method is used here because the values of Xi and fi are very small.
Question 2. Consider the following distribution of daily wages of 50 workers of a factory.
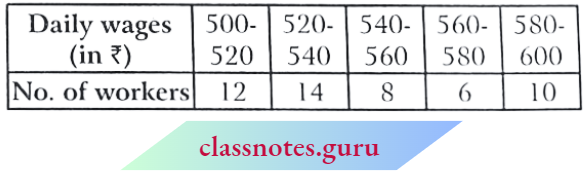
Find the mean daily wages of the workers of the factory by using an appropriate method.
Solution:
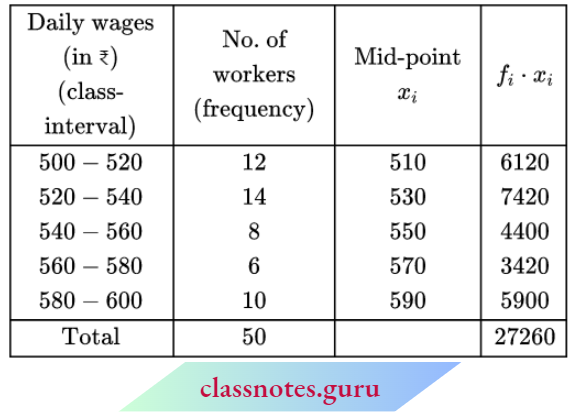
Mean \(\bar{x}=\frac{\sum f_i \cdot x_i}{\sum f_i}=\frac{27260}{50}=545.20\)
∴ Mean wages of workers = ₹ 545.20
Question 3. The following distribution shows the daily pocket allowance of children of a locality. The mean pocket allowance is ₹ 18. Find the missing frequency f:
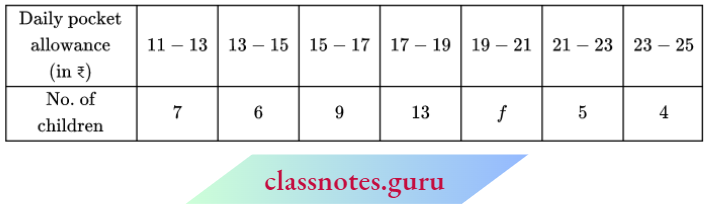
Solution:
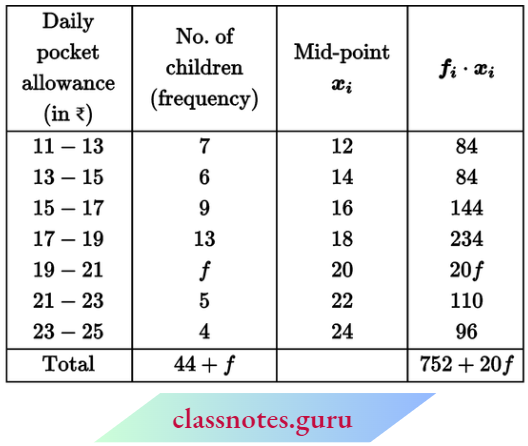
Now, mean pocket allowance = \(\frac{\sum f_i \cdot x_i}{\sum f_i}\)
⇒ \(18=\frac{752+20 f}{44+f}\)
⇒ 792 + 18f = 752 + 20f
⇒ 792 – 752 = 20f – 18f
⇒ 40 = 2f ⇒ f = 20
The missing frequency f = 20
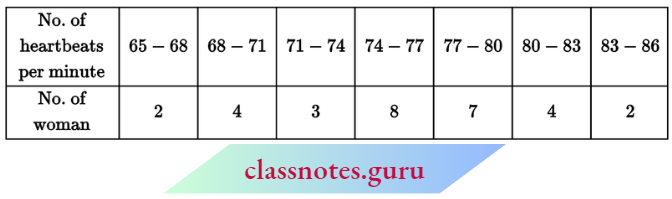
Question 4. Thirty women were examined in a hospital by a doctor and the number of heartbeats per minute were recorded and summarised as follows. Find the mean heartbeats per minute for these women, choosing a suitable method.
Solution:
Let assumed mean A = 75.6
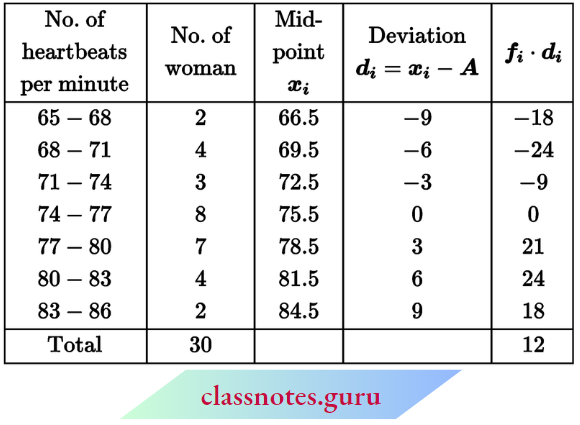
∴ Mean heartbeats per minute
⇒ \(\bar{x}=A+\frac{\sum f_i \cdot d_i}{\sum f_i}=75.5+\frac{12}{30}\)
= 75.5 + 0.4 = 75.9
The mean heartbeats per minute for these women = 75.9
Question 5. In a retail market, fruit vendors were selling mangoes kept in packing boxes. These boxes contained varying numbers of mangoes. The following was the distribution of mangoes according to the number of boxes:
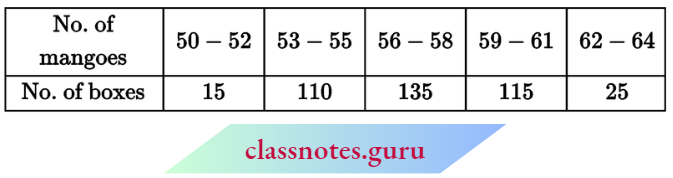
Find the mean number of mangoes kept in a packing box. Which method of finding the mean did you choose?
Solution:
Here, h = 3
Let assumed mean A = 57
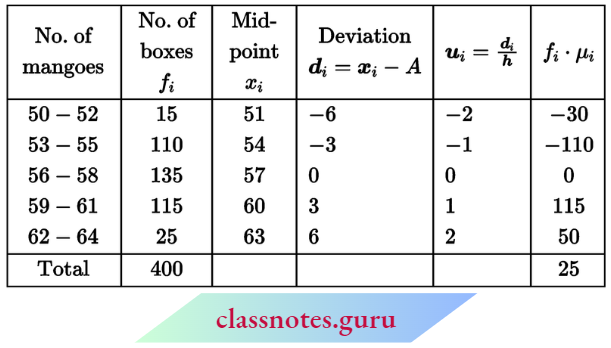
∴ Mean \(\bar{x}=A+h \cdot \frac{\sum f_i \cdot u_i}{\sum f_i}\)
= \(57+\frac{3 \times 25}{400}=57+0.1875\)
= 57.1875
∴ Mean number of mangoes = 57.1875
≈ 57.19
Here, the assumed mean method is used.
Question 6. The table below shows the daily expenditure on food of 25 households in a locality.
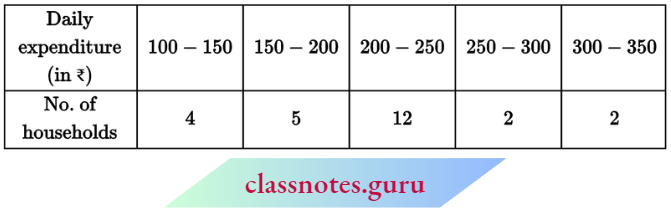
Find the mean daily expenditure on food by a suitable method.
Solution:
Here, h = 50
Let assumed mean A = ₹ 225
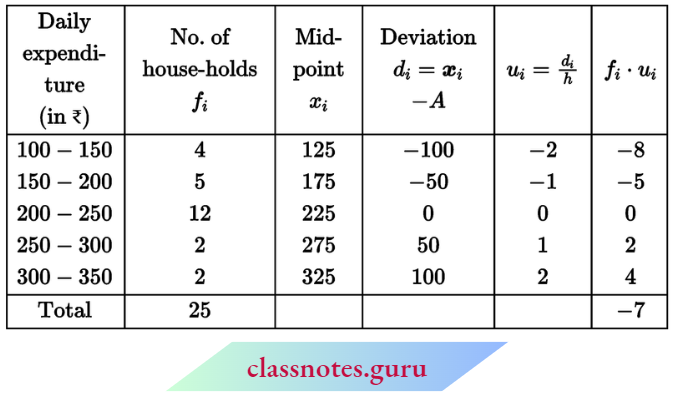
∴ Mean \(\bar{x}=A+h \cdot \frac{\sum f_i \cdot u_i}{\sum f_i}\)
= \(225+50 \times \frac{(-7)}{25}\)
= 225 – 14 = ₹ 221
Therefore, the mean daily expenditure on food per family = ₹ 211.
Question 7. To find out the concentration of SO2 in the air (in parts per million, i.e., ppm), the data was collected for 30 localities in a certain city and is presented below:
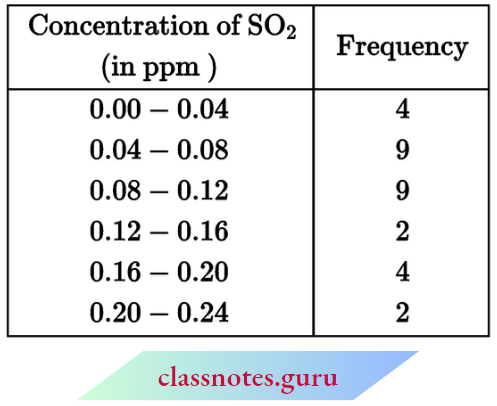
Find the mean concentration of SO2 in the air.
Solution:
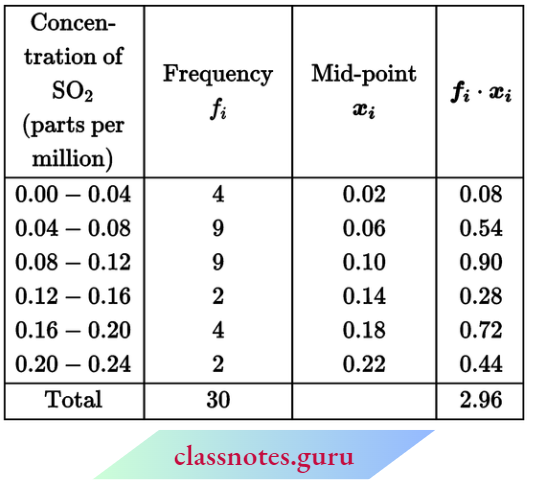
∴ Mean \(\bar{x}=\frac{\sum f_i \cdot x_i}{\sum f_i}=\frac{2}{30}\)
= 0.0986 parts per million.
The mean concentration of SO2 in the air = 0.0986 parts per million.
Question 8. A class teacher has the following absentee record of 40 students of a class for the whole term. Find the mean number of days a student was absent.
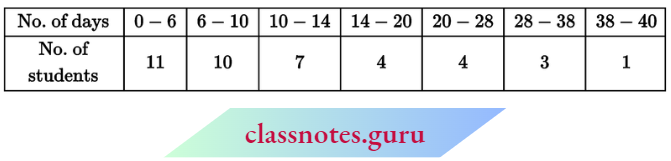
Solution:
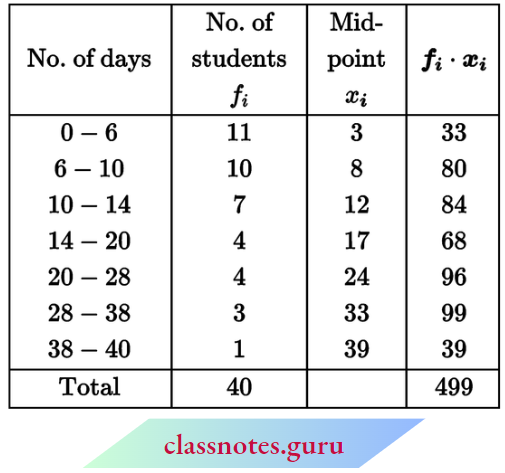
Mean \(\bar{x}=\frac{\sum f_i \cdot x_i}{\sum f_i}=\frac{499}{40}=12.475\)
∴ The mean number of absences of students = 12.475 days per student
Question 9. The following table gives the literacy rate (in percentage) of 35 cities. Find the mean literacy rate.
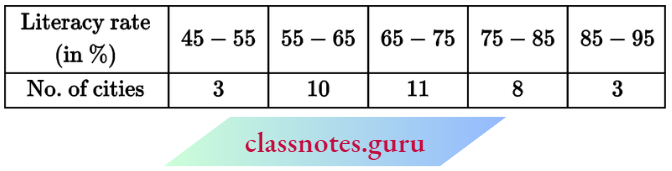
Solution:
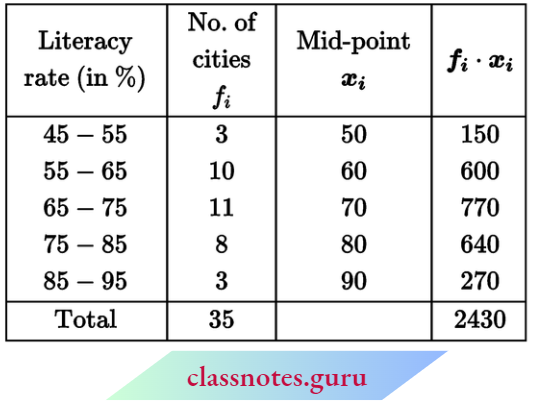
Mean \(\bar{x}=\frac{\sum f_i \cdot x_i}{\sum f_i}=\frac{2430}{35}=69.43\)
∴ The mean percentage rate of literacy = 69.43
NCERT Exemplar Solutions for Class 10 Maths Chapter 14 Statistics Exercise 14.2
Question 1. The following table shows the ages of the patients admitted to a hospital during a year:
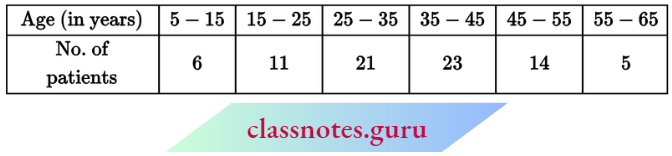
Find the mode and the mean of the data given above. Compare and interpret the two measures of central tendency.
Solution:
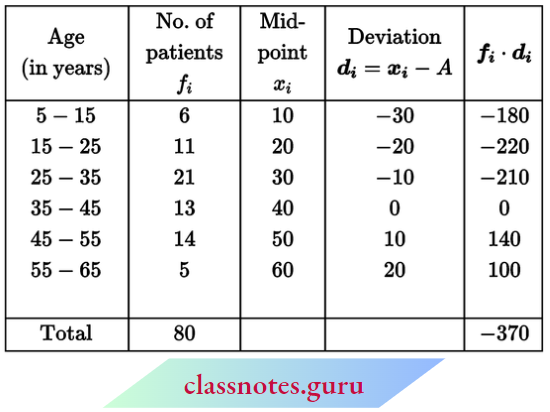
Lot assumed mean A = 40
∴ Mean \(\bar{x}=A+\frac{\sum f_1 \cdot d_i}{\sum f_i}=40+\frac{(-370)}{80}\)
= 40 – 4.625
= 35.375 years
For more,
Highest frequency = 23
∴ Modal class: 35 – 45
Now, l1= 35, l2 = 45
f = 23, f1 =21, f2 = 14
and mode = \(l_1+\frac{\left(f-f_1\right)\left(l_2-l_1\right)}{2 f-f_1-f_2}\)
= \(35+\frac{(23-21)(45-35)}{46-21-14}\)
= \(35+\frac{2 \times 10}{11}\)
= 35. 1.8 = 36.8 years.
Mode = 36.8 years.
Question 2. The following data gives information on the observed lifetimes (in hours) of 225 electrical components:
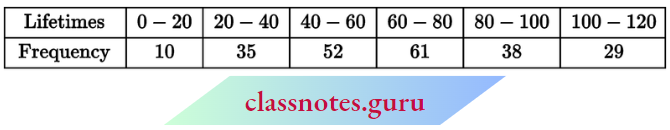
Determine the modal lifetime of the components.
Solution:
Highest frequency = 61
∴ Modal class: 60 – 80
Now, l1 = 60, l2 = 80
f = 61, f1 = 52, f2 = 38
and mode = \(l_1+\frac{\left(f-f_1\right)\left(l_2-l_1\right)}{2 f-f_1-f_2}\)
= \(60+\frac{(61-52)(80-60)}{2 \times 61-52-38}\)
= \(\begin{equation}
60+\frac{9 \times 20}{32}=60+5.625
\end{equation}\)
= 65.625 hours
Question 3. The following data gives the distribution of the total monthly household expenditure of 200 families in a village. Find the modal monthly expenditure of the families. Also, find the mean monthly expenditure:
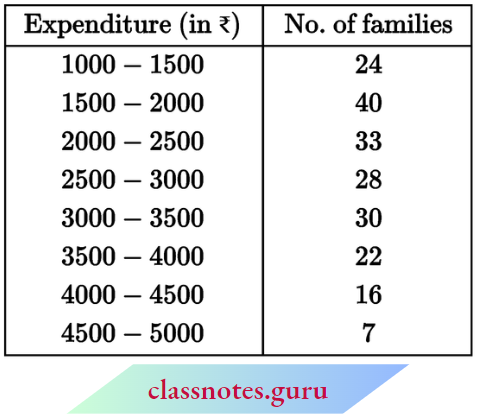
Solution:
Highest frequency = 40
∴ Modal class: 1500-2000
Now, l1 = 1500, l2 = 2000
f = 40, f1 = 24, f2= 33
and mode = \(l_1+\frac{\left(f-f_1\right)\left(l_2-l_1\right)}{2 f-f_1-f_2}\)
= \(1500+\frac{(40-24)(2000-1500)}{2 \times 40-24-33}\)
= \(1500+\frac{16 \times 500}{23}\)
= 1500 + 347.83 = ₹ 1847.83
Let assumed A = ₹ 2750
Here, h = 500
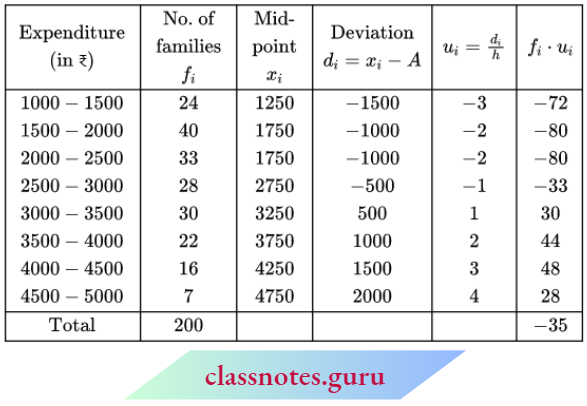
Mean Monthly expenditure
⇒ \(\bar{x}=A+h \cdot \frac{\sum f_i \cdot u_i}{\sum f_i}\)
⇒ \(2750+\frac{500 \times(-35)}{200}\)
= 2750 – 87.50 = ₹ 2662.50
Mean Monthly expenditure = ₹ 2662.50
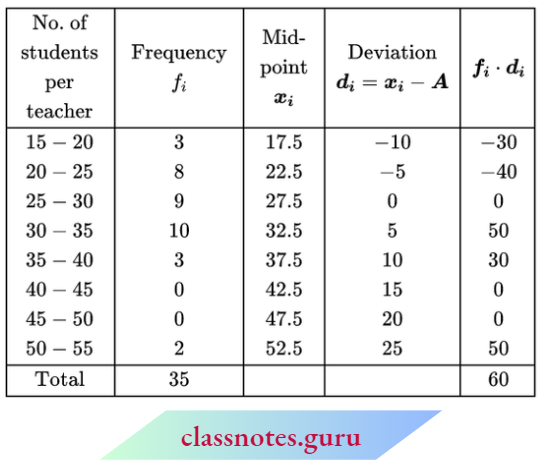
Question 4. The following distribution gives the state-wise teacher-student ratio in higher secondary schools in India. Find the mode and mean of this data. Interpret the two measures.
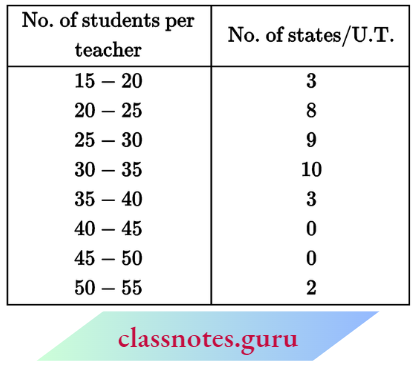
Solution:
Here, maximum frequency = 10
∴ Model class: 30-35
Now, l1 = 30, l2 = 35
f = 10, f1 = 9, fi2 = 3
and mode = \(l_1+\frac{\left(f-f_1\right)\left(l_2-l_1\right)}{2 f-f_1-f_2}\)
= \(30+\frac{(10-9)(35-30)}{2 \times 10-9-3}\)
= \(30+\frac{5}{8}=30+0.625\)
= 30.625 students per teacher
For mean,
let assumed mean A = 27.5
Now, mean = \(A+\frac{\sum f_i \cdot d_i}{\sum f_i}=27.5+\frac{60}{35}\)
= 27.5 + 1.7
= 29.2 students per teacher
So, in the higher secondary schools of India, the mean number of students per teacher is 29.2 states while the number of students per teacher in maximum states is 30.625.
Question 5. The given distribution shows the number of runs scored by some top batsmen of the world in one-day international cricket matches.
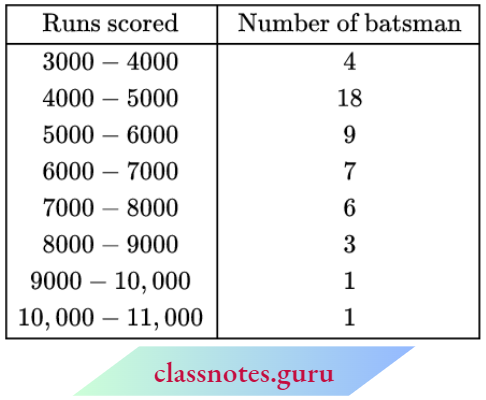
Find the mode of the data.
Solution:
Here, maximum frequency = 18
∴ Modal class: 4000 – 5000
Now, l1 = 4000, l2 = 5000
f = 18, f1 = 4, f2 = 9
and mode = \(l_1+\frac{\left(f-f_1\right)\left(l_2-l_1\right)}{2 f-f_1-f_2}\)
= \(4000+\frac{(18-4)(5000-4000)}{2 \times 18-4-9}\)
= \(4000+\frac{14 \times 1000}{23}\)
= 4000 + 608.7 = 4608.7
≈ 4608 run (approximately)
The mode of the data = 4608 run (approximately)
NCERT Exemplar Statistics Class 10 Exercise Solutions
Question 6. A student noted the number of cars passing through a spot on the road for 100 periods each of 3 minutes and summarised it in the table given below. Find the mode of the data:
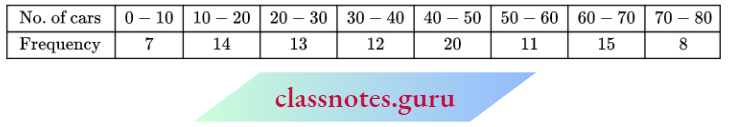
Solution:
Here, maximum frequency = 20
∴ Model class: 40-50
Now, l1 = 40, l2 = 50
f = 20, f1 = 12, f2 = 11
and mode = \(l_1+\frac{\left(f-f_1\right)\left(l_2-l_1\right)}{2 f-f_1-f_2}\)
= \(40+\frac{(20-12)(50-40)}{2 \times 20-12-11}\)
= \(40+\frac{8 \times 10}{17}=40+4.7\)
= 44.7
The mode of the data = 44.7
NCERT Exemplar Solutions for Class 10 Maths Chapter 14 Statistics Exercise 14.3
Question 1. The following frequency distribution gives the monthly consumption of electricity of 68 consumers of a locality. Find the median, mean, and mode of the data and compare them.
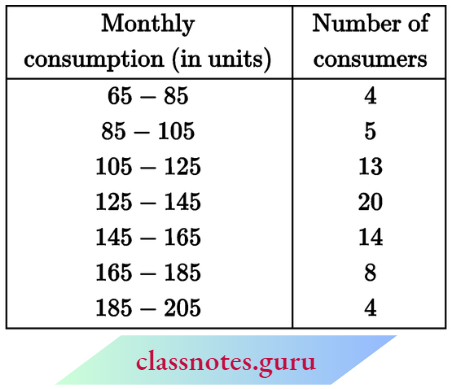
Solution:
Let assumed mean A = 115
Here, h = 20
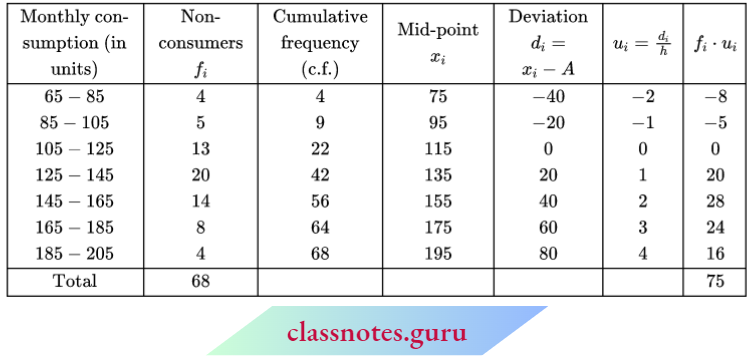
Here, N = 68
⇒ \(\frac{N+1}{2}=\frac{68+1}{2}=34.5\)
∴ Median class = 125 – 145
Now, l1 = 125, l2 = 145
f = 20, C = 22
and median (M) = \(l_1+\frac{\left(\frac{N}{2}-C\right)\left(l_2-l_1\right)}{f}\)
= \(125+\frac{\left(\frac{68}{2}-22\right)(145-125)}{20}\)
= \(125+\frac{12 \times 20}{20}\)
= 125 + 12 = 137
Mean \(\bar{x}=A+h \cdot \frac{\sum f_i \cdot d_i}{\sum f_i}\)
= \(115+\frac{20 \times 75}{68}\)
= 115 + 22.06 = 137.06
Again, maximum frequency = 20
∴ Modal class: 125-145
Now, l1 = 125, l2= 145
f = 20, f1 = 13, f2 = 14
∴ Mode = \(l_1+\frac{\left(f-f_1\right)\left(l_2-l_1\right)}{2 f-f_1-f_2}\)
= \(125+\frac{(20-13)(145-125)}{2 \times 20-13-14}\)
= \(125+\frac{7 \times 20}{13}\)
= 125 + 10.77 = 135.77
The values of median, mean and mode are equal approximately.
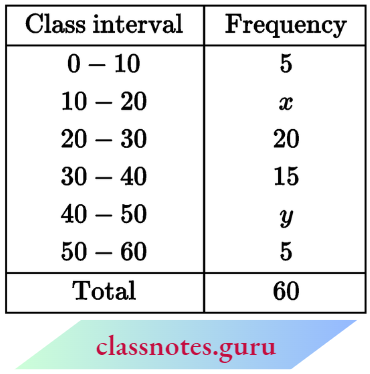
Question 2. If the median of the distribution given below is 28.5. find the value of x and y:
Solution:
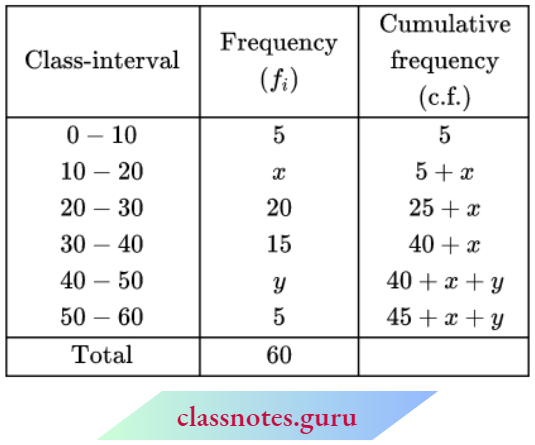
Now, 45 + x + y = 60
⇒ x + y = 15 → (1)
Given that, median = 28.5
∴ Median class: 20 – 30
Now, l1 = 20, l2 = 30
f = 20, c = 5 + x, N = 60
Median = \(l_1+\frac{\left(\frac{N}{2}-C\right)\left(l_2-l_1\right)}{f}\)
⇒ \(28.5=20+\frac{\left(\frac{60}{2}-5-x\right)(30-20)}{20}\)
⇒ \(28.5-20=\frac{(25-x)(10)}{20}\)
⇒ \(8.5=\frac{25-x}{2} \quad ⇒ \quad 17=25-x\)
⇒ x = 25 – 17 = 8
From equation (1),
8 + y = 15
⇒ y = 15 – 8 = 7
∴ x = 8, y = 7
The value of x and y is 8 and 7.
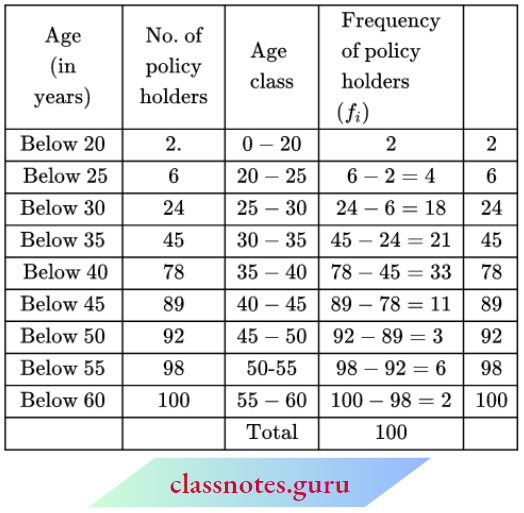
Question 3. A life insurance agent found the following data for the distribution of ages of 100 policyholders. Calculate the median age, if policies are given only to persons aged 18 years onwards but less than 60 years.
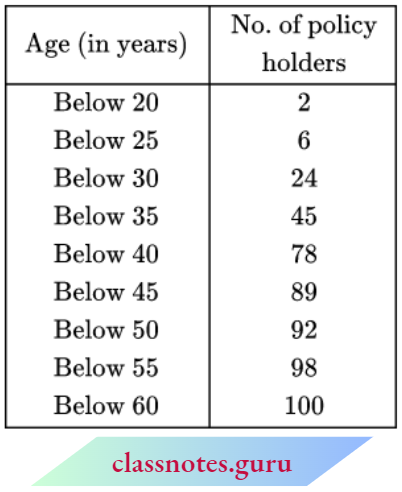
Solution:
N = 100
∴ \(\frac{N+1}{2}=\frac{100+1}{2}=50.5\)
⇒ Median class: 35 – 40
∴ l1 = 35, l2 = 40
f = 33, C = 45
Median = \(l_1+\frac{\left(\frac{N}{2}-C\right)\left(l_2-l_1\right)}{f}\)
= \(35+\frac{\left(\frac{100}{2}-45\right)(40-35)}{33}\)
= \(35+\frac{5 \times 5}{33}=35+0.76\)
= 35.76 years.
Median = 35.76 years.
Class 10 Statistics Problems and Solutions NCERT Exemplar
Question 4. The lengths of40 the leaves of a plant are measured correctly to the nearest millimeter and the data obtained is represented in the following table:
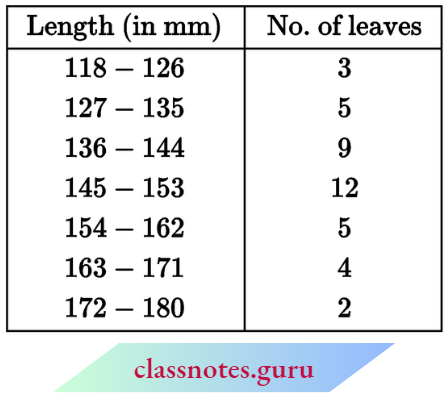
Find the median length of the leaves.
[Hint: The data needs to be converted to continuous classes for finding the median since the formula assumes continuous classes. The classes then change to 117.5-126.5, 126.5-135.5, …, 171.5 – 180.5.]
Solution:
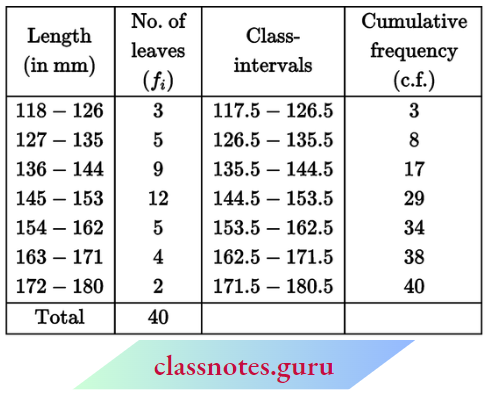
∴ \(N=40 \Rightarrow \frac{N+1}{2}=\frac{40+1}{2}=20.5\)
⇒ Median class: 144.5 – 153.5
l1 = 144.5, l2 = 153.5
f = 12, C = 17
and median = \(l_1+\frac{\left(\frac{N}{2}-C\right)\left(l_2-l_1\right)}{f}\)
= \(144.5+\frac{\left(\frac{40}{2}-17\right)(153.5-144.5)}{12}\)
= \(144.5+\frac{3 \times 9}{12}=144.5+2.25\)
= 146.75 mm
Therefore, the median length of leaves = 146.75 mm
Question 5. The following table gives the distribution of the lifetime of 400 neon lamps:
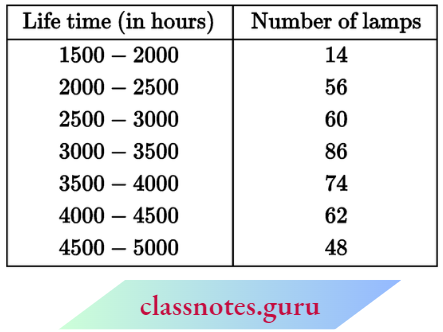
Find the median lifetime of a lamp.
Solution:
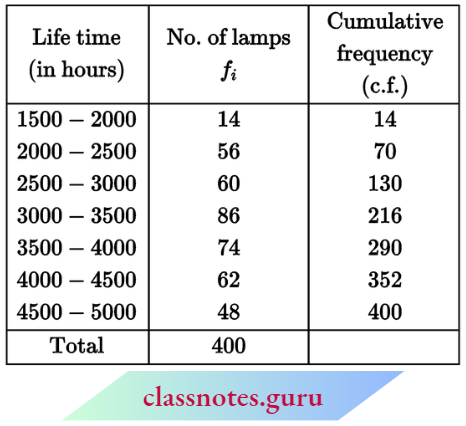
Here, N = 400
∴ \(\frac{N+1}{2}=\frac{400+1}{2}=200.5\)
Median class: 3000 – 3500
Now, l1 = 3000, l2 = 3500
f = 86, C = 130
and median = \(=l_1+\frac{\left(\frac{N}{2}-C\right)\left(l_2-l_1\right)}{f}\)
= \(=3000+\frac{\left(\frac{400}{2}-130\right)(3500-3000)}{86}\)
= \(3000+\frac{70 \times 500}{86}\)
= 3000 + 406.98 = 3406.98 hours
Therefore, the mean lifetime of lamps = 3406.98 hours.
Question 6. 100 surnames were randomly picked up from a local telephone directory and the frequency distribution of the number of letters in the English alphabets in the surnames was obtained as follows:
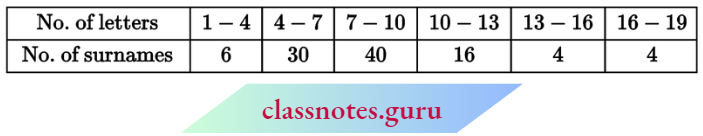
Determine the median number of letters in the surnames. Find the mean number of letters in the surnames. Also, find the modal size of the surnames.
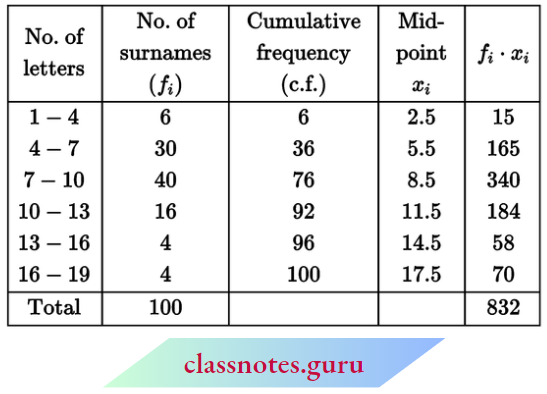
Solution:
N = 100
∴ \(\frac{N+1}{2}=\frac{100+1}{2}=50.5\)
⇒ Median class: 7 – 10
Now, l1 = 7, l2 = 10
f = 40, C = 36
∴ Median = \(l_1+\frac{\left(\frac{N}{2}-C\right)\left(l_2-l_1\right)}{f}\)
= \(7+\frac{\left(\frac{100}{2}-36\right)(10-7)}{40}\)
= \(7+\frac{14 \times 3}{40}\)
= 7 + 1.05 = 8.05
Mean = \(\frac{\sum f_i \cdot x_i}{\sum f_i}=\frac{832}{100}=8.32\)
Fir mode,
Maximum frequency = 40
∴ Modal class 7 – 10
Now, l1 = 7, l2 = 10
f = 40, f1 = 30, f2 = 16
and mode = \(l_1+\frac{\left(f-f_1\right)\left(l_2-l_1\right)}{2 f-f_1-f_2}\)
= \(7+\frac{(40-30)(10-7)}{2 \times 40-30-16}\)
= \(7+\frac{10 \times 3}{34}\)
= 7 + 0.88 = 7.88
Mode = 7.88
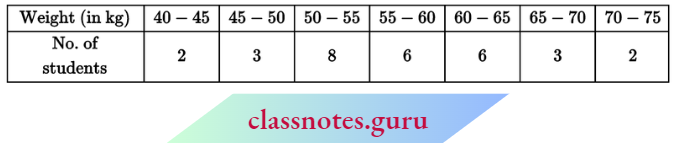
Question 7. The distribution below gives the weights of 30 students in a class. Find the median weight of the students.
Solution:
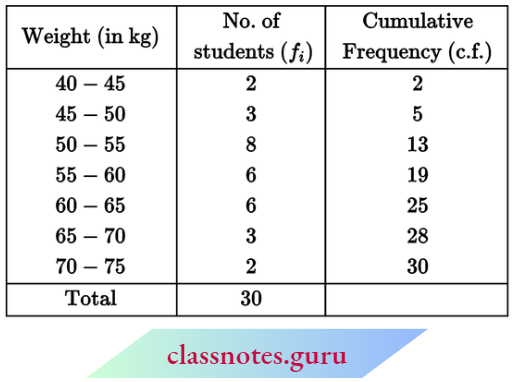
Here, N = 30
∴ \(\frac{N+1}{2}=\frac{30+1}{2}=15.5\)
⇒ Median class: 55 – 60
Now, l1 = 55, l2 = 60, f = 6, C= 13
and median = \(l_1+\frac{\left(\frac{N}{2}-C\right)\left(l_2-l_1\right)}{f}\)
= \(55+\frac{\left(\frac{30}{2}-13\right)(60-55)}{6}\)
= \(55+\frac{2 \times 5}{6}\)
= 55 + 1.67
= 56.67 kg
NCERT Exemplar Solutions for Class 10 Maths Chapter 14 Statistics Exercise 14.4
Question 1. The following distribution gives the daily income of 50 workers of a factory.
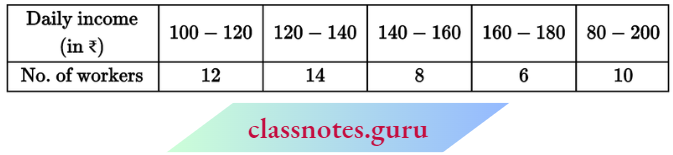
Convert the distribution above to a less type cumulative frequency distribution, and draw its ogive.
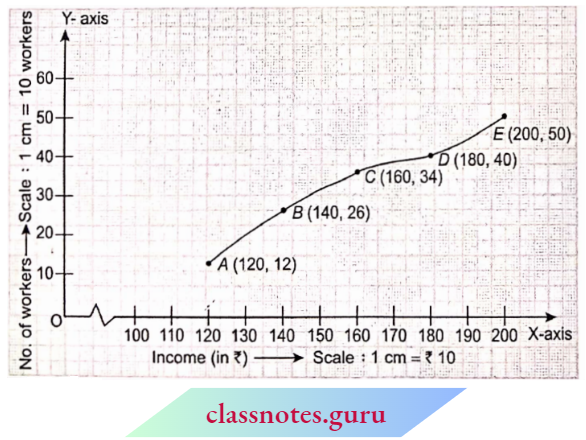
Solution:
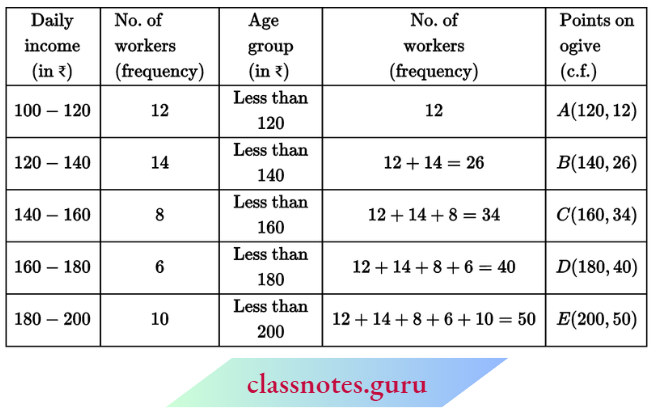
Cumulative frequency curve (ogive)
NCERT Exemplar Class 10 Statistics Chapter 14 Important Questions
Question 2. During the medical check-up of 35 students of a class, their weights were recorded as follows:
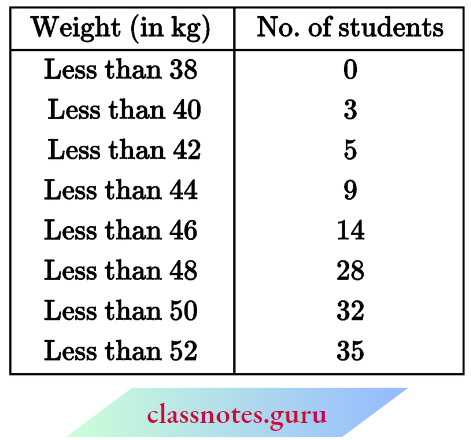
Draw a less than type ogive for the given data. Hence obtain the median weight from the graph and verify the result by using the formula.
Solution:
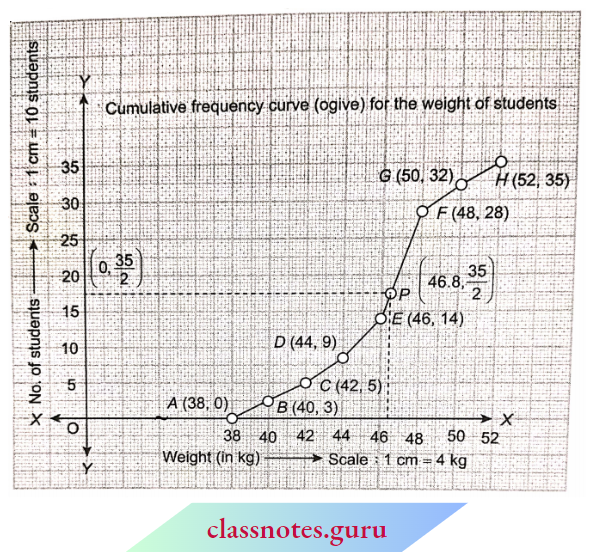
To find the median:
- Take the point \(\left(0, \frac{N}{2}\right) \equiv\left(0, \frac{35}{2}\right)\) on Y-axis.
- Draw a line parallel to the X-axis from points \(\left(0, \frac{35}{2}\right)\) which is the curve at point P.
- Find the abscissa of point P (read). It is 46.8.
- Therefore, the required median = 46.8 kg.
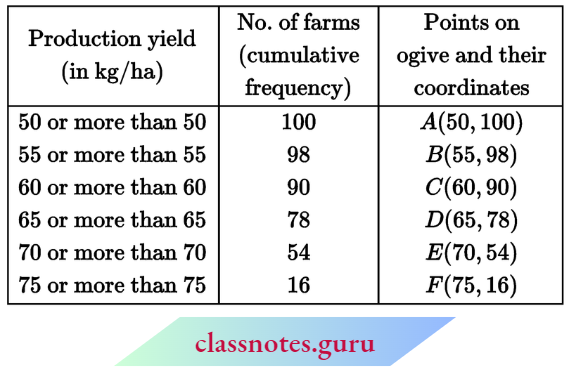
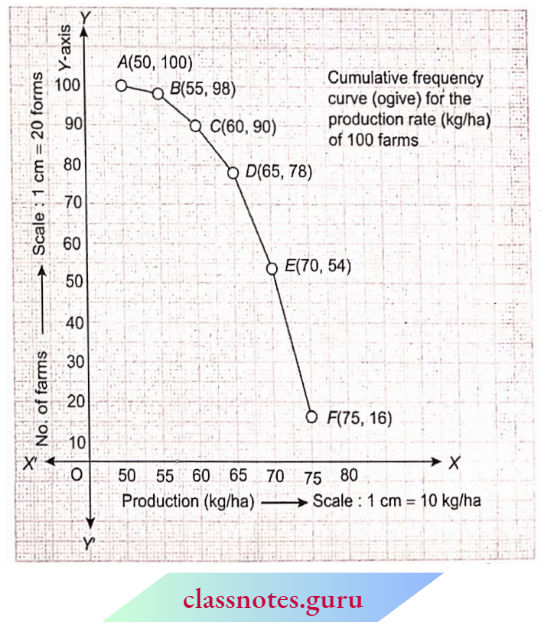
Question 3. The following table gives the production yield per hectare of the heat of wheat of 100 farms in a village.
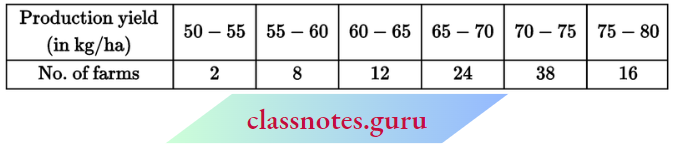
Change the distribution to a more than type distribution, and draw its ogive.
Solution:
Convert the given distribution to the ‘more than’ type distribution.
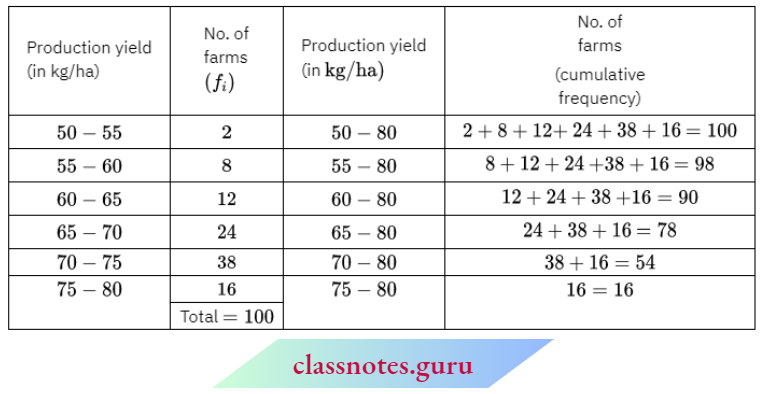
Distribution of “More than” type
NCERT Exemplar Solutions for Class 10 Maths Chapter 14 Statistics Multiple Choice Questions And Answers
Question 1. In the formula \(\bar{x}=a+\frac{\Sigma f_i d_i}{\Sigma f_i}\) to determine the mean of grouped data, di is the deviation from and the following:
- The lower limit of classes
- The upper limit of classes
- Mid-point of classes
- Frequencies of classes
Answer: 3. Mid-point of classes
Question 2. If xi is the mid-points of class intervals of grouped data and fi are their corresponding frequencies, then the value of Σ(fi – xi – \(\bar{x}\)) is:
- -1
- 0
- 1
- None of these
Answer: 2. 0
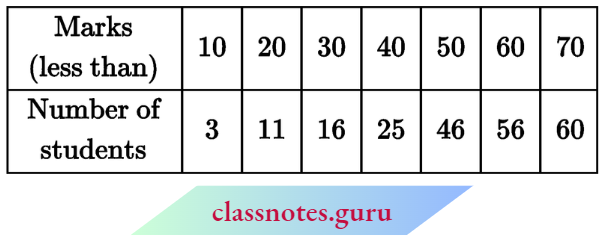
Question 3. For the distribution
the sum of the upper limits of the median class and modal class is:
- 70
- 50
- 60
- 30
Answer: 1. 70
Question 4. The abscissa of the point of intersection of cumulative frequency curves of ‘less than type’ and ‘more than type’ gives the ______ of the data:
- Mean
- Median
- Mode
- All of these
Answer: 2. Median
Question 5. A cumulative frequency curve is necessary in
- Mean
- Median
- Mode
- All of these
Answer: 2. Median
Question 6. For the distribution
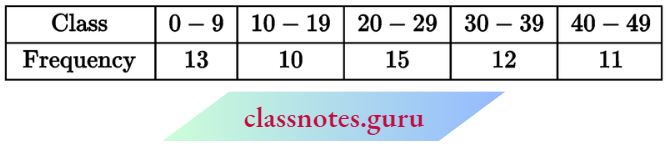
the upper limit of the median class is:
- 19
- 19.5
- 29
- 29.5
Answer: 4. 29.5
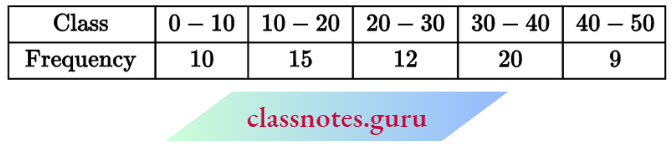
Question 7. In the distribution
the modal class is:
- 20 – 30
- 30 – 40
- 40 – 50
- 50 – 60
Answer: 3. 40 – 50
Question 8. The modal class of the following frequency distribution will be
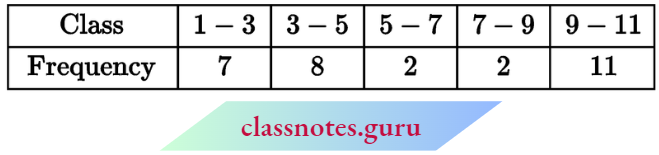
- 1 – 3
- 3 – 5
- 5 – 7
- 7 – 9
Answer: 2. 3 – 5
Question 9. The arithmetic mean of 3, 4, 6, and x is 5. The value of x will be:
- 5
- 2
- 7
- 3
Answer: 3. 7
Statistics NCERT Exemplar Class 10 Sample Paper Questions
Question 10. The arithmetic mean of positive even numbers from 1 to 10 will be:
- 2
- 4
- 6
- 5
Solution: 3. 6
Question 11. 1 hejnean ol n observations is \(\bar{x}\). If each observation is increased by a, then the new mean will be:
- \(\bar{x}\)+ a
- \(\bar{x}\)+ a/2
- \(\bar{x}\)– a
- \(\bar{x}\)– a/2
Answer: 1. \(\bar{x}\)+ a
Question 12. For a frequency distribution, the relation between mean, median, and mode is:
- Mode = 3 mean – 2 median
- Mode = 2 median – 3 mean
- Mode = 3 median – 2 mean
- Mode = 3 median + 2 mean
Answer: 3. Mode = 3 median – 2 mean
Question 13. The mean of natural number from 1 to 9 will be:
- 3
- 5
- 8
- 9
Answer: 2. 5
Question 14. For a frequency distribution, the mean is 20.5 and the median is 20. Its mode will be:
- 21.5
- 17
- 19
- 20.5
Answer: 3. 19